To express: The given data in a frequency table and a histogram
Answer to Problem 1MCQ
The frequency table

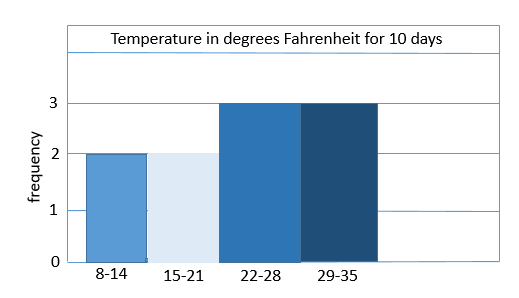
The histogram for the data

Explanation of Solution
Given information :
The following low temperatures in degrees Fahrenheit recorded over a period of 10 days:
28,14,8,26,18,15,30,31,30,28.
Calculation :
As per the problem,
To make a frequency table, choose intervals of equal size for the data.
Make intervals of 7 degrees.
Use a tally mark to record the interval in which each data value falls.
Write the frequency of each interval by counting the number of tally marks corresponding to the intervals.
The frequency table:

Use the frequency table to draw the histogram
Show the intervals from the frequency table on the horizontal axis and show the frequencies on the vertical axis.
Draw a bar to represent the frequency for each interval.
Give the histogram a title.
The histogram:

Chapter 11 Solutions
Holt Mcdougal Larson Pre-algebra: Student Edition 2012
Additional Math Textbook Solutions
A Problem Solving Approach To Mathematics For Elementary School Teachers (13th Edition)
Intro Stats, Books a la Carte Edition (5th Edition)
Elementary Statistics (13th Edition)
Elementary Statistics: Picturing the World (7th Edition)
- Chapter 4 Quiz 2 As always, show your work. 1) FindΘgivencscΘ=1.045. 2) Find Θ given sec Θ = 4.213. 3) Find Θ given cot Θ = 0.579. Solve the following three right triangles. B 21.0 34.6° ca 52.5 4)c 26° 5) A b 6) B 84.0 a 42° barrow_forwardQ1: A: Let M and N be two subspace of finite dimension linear space X, show that if M = N then dim M = dim N but the converse need not to be true. B: Let A and B two balanced subsets of a linear space X, show that whether An B and AUB are balanced sets or nor. Q2: Answer only two A:Let M be a subset of a linear space X, show that M is a hyperplane of X iff there exists ƒ€ X'/{0} and a € F such that M = (x = x/f&x) = x}. fe B:Show that every two norms on finite dimension linear space are equivalent C: Let f be a linear function from a normed space X in to a normed space Y, show that continuous at x, E X iff for any sequence (x) in X converge to Xo then the sequence (f(x)) converge to (f(x)) in Y. Q3: A:Let M be a closed subspace of a normed space X, constract a linear space X/M as normed space B: Let A be a finite dimension subspace of a Banach space X, show that A is closed. C: Show that every finite dimension normed space is Banach space.arrow_forward• Plane II is spanned by the vectors: P12 P2 = 1 • Subspace W is spanned by the vectors: W₁ = -- () · 2 1 W2 = 0arrow_forward
- Three streams - Stream A, Stream B, and Stream C - flow into a lake. The flow rates of these streams are not yet known and thus to be found. The combined water inflow from the streams is 300 m³/h. The rate of Stream A is three times the combined rates of Stream B and Stream C. The rate of Stream B is 50 m³/h less than half of the difference between the rates of Stream A and Stream C. Find the flow rates of the three streams by setting up an equation system Ax = b and solving it for x. Provide the values of A and b. Assuming that you get to an upper-triangular matrix U using an elimination matrix E such that U = E A, provide also the components of E.arrow_forwarddent Application X GA spinner is divided into five cox | + 9/26583471/4081d162951bfdf39e254aa2151384b7 A spinner is divided into five colored sections that are not of equal size: red, blue, green, yellow, and purple. The spinner is spun several times, and the results are recorded below: Spinner Results Color Frequency Red 5 Blue 11 Green 18 Yellow 5 Purple 7 Based on these results, express the probability that the next spin will land on purple as a fraction in simplest form. Answer Attempt 1 out of 2 Submit Answer 0 Feb 12 10:11 Oarrow_forward2 5x + 2–49 2 x+10x+21arrow_forward
- 5x 2x+y+ 3x + 3y 4 6arrow_forwardCalculați (a-2023×b)²⁰²⁴arrow_forwardA student completed the problem below. Identify whether the student was correct or incorrect. Explain your reasoning. (identification 1 point; explanation 1 point) 4x 3x (x+7)(x+5)(x+7)(x-3) 4x (x-3) (x+7)(x+5) (x03) 3x (x+5) (x+7) (x-3)(x+5) 4x²-12x-3x²-15x (x+7) (x+5) (x-3) 2 × - 27x (x+7)(x+5) (x-3)arrow_forward
- 2 Add the rational expressions below. Can you add them in this original form? Explain why or why not. 3x-7 5x + x² - 7x+12 4x-12 Show all steps. State your least common denominator and explain in words your process on how you determined your least common denominator. Be sure to state your claim, provide your evidence, and provide your reasoning before submitting.arrow_forwardcarol mailed a gift box to her sister the boxed gift weighed a total of 2 pounds the box alone weighed 13 ounces what was the wright of the giftarrow_forwardDirections: Use the table below to answer the following questions and show all work. Heights of Females 50.0 51.5 53.0 53.5 54.0 1. What is the average female height? 2. What are all the differences from the mean? 3. What is the variance for the female heights? 4. What is the standard deviation of the heights of the females? 5. What does the standard deviation found in number 4 represent? Write your answer in complete sentences.arrow_forward
 Algebra and Trigonometry (6th Edition)AlgebraISBN:9780134463216Author:Robert F. BlitzerPublisher:PEARSON
 Contemporary Abstract AlgebraAlgebraISBN:9781305657960Author:Joseph GallianPublisher:Cengage Learning
 Linear Algebra: A Modern IntroductionAlgebraISBN:9781285463247Author:David PoolePublisher:Cengage Learning
 Algebra And Trigonometry (11th Edition)AlgebraISBN:9780135163078Author:Michael SullivanPublisher:PEARSON
 Introduction to Linear Algebra, Fifth EditionAlgebraISBN:9780980232776Author:Gilbert StrangPublisher:Wellesley-Cambridge Press
 College Algebra (Collegiate Math)AlgebraISBN:9780077836344Author:Julie Miller, Donna GerkenPublisher:McGraw-Hill Education


