
EBK THINKING LIKE AN ENGINEER
4th Edition
ISBN: 8220103633512
Author: OHLAND
Publisher: PEARSON
expand_more
expand_more
format_list_bulleted
Concept explainers
Videos
Textbook Question
Chapter 11, Problem 16ICA
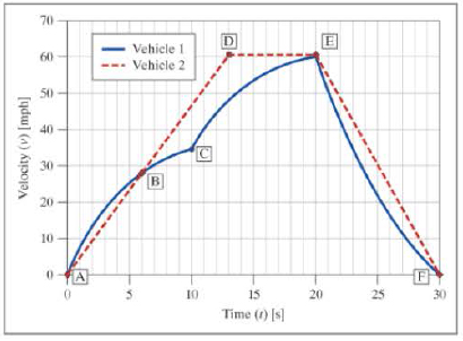
Use the following graph to determine which statements about the two vehicles are true.
- a. At point B, the distance traveled by Vehicle 1 is equal to the distance traveled by Vehicle 2.
- b. At point B, the velocity of Vehicle 1 is equal to the velocity of Vehicle 2.
- c. The average acceleration of Vehicle 1 between points B and C is equal to the average acceleration of Vehicle 2 between points D and E.
- d. At point E, the distance traveled by Vehicle 1 is greater than the distance traveled by Vehicle 2.
- e. At point E, the velocity of Vehicle 1 is greater than the velocity of Vehicle 2.
- f. The average acceleration of Vehicle 1 between points E and F is greater than the average acceleration of Vehicle 2 between points E and F.
Expert Solution & Answer
Want to see the full answer?
Check out a sample textbook solution
Students have asked these similar questions
QUESTION 2
The graph below represents the distance-time relationship from Justin and Nicole as they cycled on a road
from mile marker 291 to mile marker 298
3
2.5
2
+5
1
0.5
Justin's distance-time relationship
Nicole's distance-time relationship
-3-201 1 2 3 4 5 6 7 8 9 1011121314151617181920
Note that the horizontal axis represents time elapased (in minutes) since passing mile marker 291 and the
vertical axis represents the disance traveled (in miles) since passing mile marker 291.
a) How does the distance traveled and time elapsed compare for Nicole and Justin as they traveled from
mile marker 291 to mile marker 298 ?
b) How do Nicole's and Justin's speeds compare as they travel from mile marker 291 to mile marker 298
?
c) How do Nicole's and Justin's average speeds compare over the time interval as they traveled from mile
marker 291 to mile marker 298 ?
d) Do Nicole and Justin collide on the course 18 minutes after they passed mile marker 291 ? Explain your
answer.
A team is preparing for the Shell Eco Marathon Asia competition. While studying the optimum fuel consumption of the vehicle, they observed a motion as described by the v-t graph shown. Draw the s-t and a-t graphs for the motion.
Using graphical method solve this problem:
Suppose you first walk A in a direction of B west of north then C in a direction D south of west. You rest for 20 minutes and started to compute the distance you traveled. Take A, B, C and D found in the table below. (You may use scale such as 1cm = 2m in your drawing)
C. What is the angle between AC ?
D. What is the angle between your first walk A to the resultant R?
Chapter 11 Solutions
EBK THINKING LIKE AN ENGINEER
Ch. 11.2 - In the following experimental data plot, identify...Ch. 11.2 - In the following experimental data plot, identify...Ch. 11.2 - In the following theoretical data plot, identify...Ch. 11.2 - In the following theoretical data plot, identify...Ch. 11.4 - Use the graph to answer the following questions....Ch. 11.5 - Use the graph to answer the following questions....Ch. 11.6 - We assume that the current through two...Ch. 11.6 - You are working for a tire manufacturer, producing...Ch. 11.6 - You want to install a solar panel system on your...Ch. 11 - Joules first law relates the heat generated to...
Ch. 11 - Data for a wind turbine is shown below. Use the...Ch. 11 - There is a large push in the United States to...Ch. 11 - Your team has designed three tennis ball...Ch. 11 - Plot the following pairs of functions on a single...Ch. 11 - Plot the following pairs of functions on a single...Ch. 11 - You need to create a graph showing the...Ch. 11 - The decay of a radioactive isotope can be modeled...Ch. 11 - In researching alternate energies, you find that...Ch. 11 - The following graph applies to ICA 11-10 to ICA...Ch. 11 - The following graph applies to ICA 11-10 to ICA...Ch. 11 - The following graph applies to ICA 11-10 to ICA...Ch. 11 - The following graph applies to ICA 11-10 to ICA...Ch. 11 - The following graph applies to ICA 11-10 to ICA...Ch. 11 - The following graph applies to ICA 11-10 to ICA...Ch. 11 - Use the following graph to determine which...Ch. 11 - The following graph shows the power delivered to a...Ch. 11 - The music industry in the United States has had a...Ch. 11 - You are working for a chemical manufacturer,...Ch. 11 - Use the accompanying graph to answer the following...Ch. 11 - A company designs submersible robots with a new...Ch. 11 - Your company is manufacturing a complex part from...Ch. 11 - For questions 1 through 10, your instructor will...Ch. 11 - 2. Due to increased demand, an industrial engineer...Ch. 11 - 3. An engineer is conducting tests of two...Ch. 11 - 4. Several reactions are carried out in a closed...Ch. 11 - 5. The following experimental data are collected...Ch. 11 - 6. If an object is heated, the temperature of the...Ch. 11 - 7. Eutrophication is the result of excessive...Ch. 11 - 8. In the 1950s, a team at Los Alamos National...Ch. 11 - Prob. 9RQCh. 11 - 10. One of the 22 named, derived units in the...Ch. 11 - Shown are graphs of the altitude in meters, and...Ch. 11 - Answer the following questions using the graph....Ch. 11 - Answer the following questions using the graph....Ch. 11 - In a simple electric circuit, the current (I) must...Ch. 11 - In a hard drive design, the faster the disk spins,...Ch. 11 - We have decided to become entrepreneurs by raising...Ch. 11 - As an engineer, suppose you are directed to design...Ch. 11 - We have obtained a contract to construct metal...Ch. 11 - Your company has developed a new high-mileage...Ch. 11 - One of the 14 Grand Challenges for Engineering as...Ch. 11 - You are an engineer for a plastics manufacturing...Ch. 11 - When a wine generator is installed there is a...
Knowledge Booster


Learn more about
Need a deep-dive on the concept behind this application? Look no further. Learn more about this topic, mechanical-engineering and related others by exploring similar questions and additional content below.Similar questions
- y B/A= A B X Two vehicles, A and B, move through an intersection as seen in the image above. At this instant, vehicle A's speed is 40 km/h and vehicle B's speed is 10 km/h. What is the relative velocity of B with respect to A. i.e. B/A? Write your answer in Cartesian vector component form using integer values. Enter negative values if necessary. Number VB î+ Number j km/h BY SA USask Engineeringarrow_forwardJUST DRAW THE SCHEMATIC DIAGRAM. NO NEED TO SOLVE. THANK YOU In Rizal province, one of its power plants has been thoroughly monitored for possible conversion into a wind power plant. A propeller wind turbine is to be used. Survey showed that Rizal Province at a height of 10 meters above the ground has a minimum wind speed of 7.1 miles per hour duringthe month of June and a maximum wind speed of 12.9 miles per hour during the month of January. The minimum temperature is at 75 degree Fahrenheit during the month of January and maximum temperature is at 89 degree Fahrenheit during the month of May. The existing power plant has an output of 54MW. For the proposed wind power, the power coefficient of turbine is 35% and the generator efficiency is 95%. Theimpeller diameter is assumed not to exceed 90m. Determine the following:a. Theoretical Wind Power Outputb. Electrical Power Outputc. Number of turbines to be installedarrow_forwardA plane traveled in the wind. The pilot needed to determine the flying angle to compensate for the effect of the wind. The pilot knew the wind vector (30 m/s, 220 degrees), and was paid to go to a destination at 140 degrees. The pilot wrote the destination vector as (unknown resultant speed, 140 degree) and the plane vector as (45 m/s, unknown flying angle). Use vector drawing to find the unknown resultant speed and unknown flying angle. Show a vector diagram with scale. Hints Draw the wind vector first, then use the end-tip of the wind vector to draw the destination vector as a line at 140 degrees, then use the start-tip of wind vector to draw a circle with radius 45 m/s. Use the intersection of the 45 m/s radius circle and the 140 degrees line to complete the vector triangle.arrow_forward
- Write a function f(t) to express the height of the rider relative to the centre of the wheelat time t seconds after the ride starts.Write a second function g(t) to express the position of the end of the bar (the centre of the rider’s wheel) relative to the ground at time t seconds. Graph each of the two functions for a 2-min ride Find the derivative of f(t) and g(t). Based on the graphs, what is the maximum heightreached be the rider? When does this occur? Find the acceleration function for f(t) and g(t). Based on those derivative functions,what is the maximum vertical speed of the rider? Design your own double Ferris wheel. Determine the position function for rider on your wheel. What is the maximum speed experienced by your riders? Is there simple relationship between the dimensions of the Ferris wheel and the maximum heights or speeds experienced?arrow_forwardUPVOTE will be given! Please write the complete solutions legibly. No long explanation needed. Answer in 2 decimal places. Dynamics of Rigid Bodies A particle moves that is defined by the parametric equations given below (where x and y are in meters, and t is in 2 seconds). x = 3t2 - 1 ; y = t3 - 3t2 + t - 3 c. radial component of the acceleration (m/s2) d. transverse component of the acceleration (m/s2)arrow_forwardFrom rest, a food truck accelerated at a constant rate of 3.25 (meter per second squared) for 15 (seconds). Then, the food truck drove at a constant speed for 5 (seconds). Determine the total distance travelled by the food truck.arrow_forward
- Using graphical method solve this problem: Suppose you first walk A in a direction of B west of north then C in a direction D south of west. You rest for 20 minutes and started to compute the distance you traveled. Take A, B, C and D found in the table below. (You may use scale such as 1cm = 2m in your drawing) A. Sketch the problem in a Cartesian plane. B. How far are you from your starting point, and what is the compass direction of a line connecting your starting point to your final position (resultant R)?arrow_forwardQUESTION 1 The motion of a jet plane during landing on a runway is described by the a – t graph as shown in Figure Q1. Construct the v – t and s – t graphs for the motion. Determine: a. the time t' when the jet plane stops a (m/s') b. the total landing distance. 10 20 t (s) (Given, so = 0 m and vo = 90 knots where 1 knot = 1.85 km/hr) -2 Figure Q1arrow_forwardSelect the graph showing Tmax versus D1 after answering the question.arrow_forward
- Using graphical method solve this problem: Suppose you first walk A in a direction of B west of north then C in a direction D south of west. You rest for 20 minutes and started to compute the distance you traveled. Take A, B, C and D found in the table below. (You may use scale such as 1cm = 2m in your drawing) A. Sketch the problem in a Cartesian plane. B. How far are you from your starting point, and what is the compass direction of a line connecting your starting point to your final position (resultant R)? C. What is the angle between AC ? D. What is the angle between your first walk A to the resultant R?arrow_forwardshow some graph where the 1st and 2nd point locatearrow_forwardTime left 0:59:02 Which of the following statement(s) is correct? O a. Paralleogram Law can be used to find resultant of more than 2 vectors O b. Paralleogram Law is never used for finding resultant vector O c. Paralleogram Law cannot be used to find resultant of more than 2 vectors If two equal vector forces are mutually perpendicular, then the resultant force is acting at which angle as compared to one of the vector? O a. 180 degree Ob. O degree Oc. 45 degree O d. 90 degreearrow_forward
arrow_back_ios
SEE MORE QUESTIONS
arrow_forward_ios
Recommended textbooks for you
 Elements Of ElectromagneticsMechanical EngineeringISBN:9780190698614Author:Sadiku, Matthew N. O.Publisher:Oxford University Press
 Mechanics of Materials (10th Edition)Mechanical EngineeringISBN:9780134319650Author:Russell C. HibbelerPublisher:PEARSON
 Thermodynamics: An Engineering ApproachMechanical EngineeringISBN:9781259822674Author:Yunus A. Cengel Dr., Michael A. BolesPublisher:McGraw-Hill Education
 Control Systems EngineeringMechanical EngineeringISBN:9781118170519Author:Norman S. NisePublisher:WILEY
 Mechanics of Materials (MindTap Course List)Mechanical EngineeringISBN:9781337093347Author:Barry J. Goodno, James M. GerePublisher:Cengage Learning
 Engineering Mechanics: StaticsMechanical EngineeringISBN:9781118807330Author:James L. Meriam, L. G. Kraige, J. N. BoltonPublisher:WILEY
Elements Of Electromagnetics
Mechanical Engineering
ISBN:9780190698614
Author:Sadiku, Matthew N. O.
Publisher:Oxford University Press
Mechanics of Materials (10th Edition)
Mechanical Engineering
ISBN:9780134319650
Author:Russell C. Hibbeler
Publisher:PEARSON
Thermodynamics: An Engineering Approach
Mechanical Engineering
ISBN:9781259822674
Author:Yunus A. Cengel Dr., Michael A. Boles
Publisher:McGraw-Hill Education
Control Systems Engineering
Mechanical Engineering
ISBN:9781118170519
Author:Norman S. Nise
Publisher:WILEY
Mechanics of Materials (MindTap Course List)
Mechanical Engineering
ISBN:9781337093347
Author:Barry J. Goodno, James M. Gere
Publisher:Cengage Learning
Engineering Mechanics: Statics
Mechanical Engineering
ISBN:9781118807330
Author:James L. Meriam, L. G. Kraige, J. N. Bolton
Publisher:WILEY
Dynamics - Lesson 1: Introduction and Constant Acceleration Equations; Author: Jeff Hanson;https://www.youtube.com/watch?v=7aMiZ3b0Ieg;License: Standard YouTube License, CC-BY