
To calculate: The sinusoidal model for the average daily temperature
The function for the given sinusoid graph is
Given information: The graph of the sinusoid is shown below.
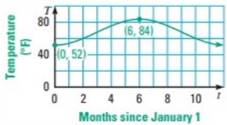
Figure (1)
Formula used: The general equation of the sinusoid function is given as:
Here,
Calculation:
From the figure (1), the maximum is
The minimum of the function is the
Calculated the vertical shift of the graph by the mean of the maximum and minimum values.
The amplitude can be calculated by the half of the difference between maximum and minimum.
Consider the negative value of
Calculate the period of the function.
From the graph it can be observed that the period is
Substitute
Write the sinusoidal model for the temperature
Therefore, the function for the given sinusoid graph is
Chapter 10 Solutions
Holt Mcdougal Larson Algebra 2: Student Edition 2012

 Algebra and Trigonometry (6th Edition)AlgebraISBN:9780134463216Author:Robert F. BlitzerPublisher:PEARSON
 Contemporary Abstract AlgebraAlgebraISBN:9781305657960Author:Joseph GallianPublisher:Cengage Learning
 Linear Algebra: A Modern IntroductionAlgebraISBN:9781285463247Author:David PoolePublisher:Cengage Learning
 Algebra And Trigonometry (11th Edition)AlgebraISBN:9780135163078Author:Michael SullivanPublisher:PEARSON
 Introduction to Linear Algebra, Fifth EditionAlgebraISBN:9780980232776Author:Gilbert StrangPublisher:Wellesley-Cambridge Press
 College Algebra (Collegiate Math)AlgebraISBN:9780077836344Author:Julie Miller, Donna GerkenPublisher:McGraw-Hill Education