To find: Analyze the equation.
The equation represents parabola.
Given:
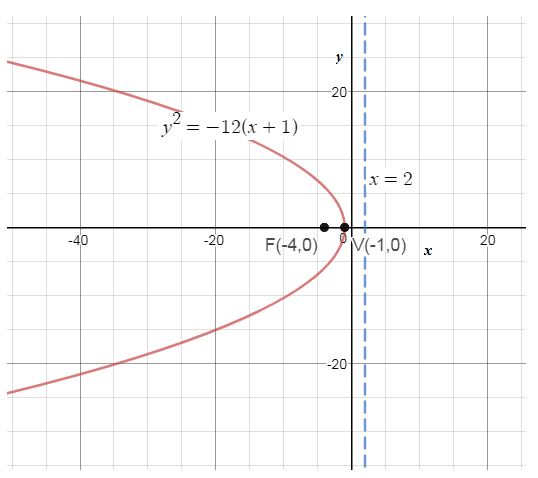
y² = −12( x + 1 )
Formula used:
Calculation:
Given that y² = −12( x + 1 ) .
The axis of symmetry is parallel to x-axis .
V( h, k ) = ( −1, 0 )
Hence, h = −1, k = 0
For a = 3 ,
F( h − a, k ) = F( −4, 0 )
The coordinates of the focus is F( −4, 0 ) .
Directrix: x = −1 + 3 = 2 .
The graph of the equation of y² = −12( x + 1 ) is plotted.
Using the given equation y² = −12( x + 1 ) , we plot the graph using graphing tool.
The graph represents a parabola, with vertex ( −1, 0 ) , directrix x = 2 and the axis of symmetry is parallel to x-axis , opens left.
Precalculus Enhanced with Graphing Utilities
Precalculus
Thomas' Calculus: Early Transcendentals (14th Edition)
University Calculus: Early Transcendentals (3rd Edition)
Glencoe Math Accelerated, Student Edition
Precalculus: Concepts Through Functions, A Unit Circle Approach to Trigonometry (4th Edition)


 Calculus: Early TranscendentalsCalculusISBN:9781285741550Author:James StewartPublisher:Cengage Learning
 Thomas' Calculus (14th Edition)CalculusISBN:9780134438986Author:Joel R. Hass, Christopher E. Heil, Maurice D. WeirPublisher:PEARSON
 Calculus: Early Transcendentals (3rd Edition)CalculusISBN:9780134763644Author:William L. Briggs, Lyle Cochran, Bernard Gillett, Eric SchulzPublisher:PEARSON
 Calculus: Early TranscendentalsCalculusISBN:9781319050740Author:Jon Rogawski, Colin Adams, Robert FranzosaPublisher:W. H. Freeman
 Calculus: Early Transcendental FunctionsCalculusISBN:9781337552516Author:Ron Larson, Bruce H. EdwardsPublisher:Cengage Learning