
Videos
Given a right triangle that has angles a, b, and 90°, draw a tine segment from the comer where the right ang|e is to the hypotenuse so that this line segment is perpendicular to the hypotenuse, as shown in Flgure 10.92 . The line segment divides the original right triangle into two smaller right triangles. Without measuring, determine the angles in these smaller right triangles. How are these angles related to the angles in the original large triangle? Give a general answer, one that does not depend on the specific values of a and b. Explain your reasoning.
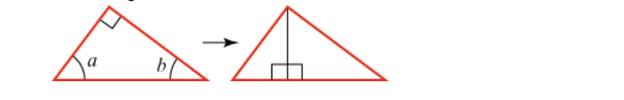
Figure 10.92 Subdivide a right triangle
Want to see the full answer?
Check out a sample textbook solution
Chapter 10 Solutions
EBK MATHEMATICS FOR ELEMENTARY TEACHERS
Additional Math Textbook Solutions
Pathways To Math Literacy (looseleaf)
University Calculus
Elementary Statistics: A Step By Step Approach
Elementary Statistics: Picturing the World (7th Edition)
Precalculus
Finite Mathematics for Business, Economics, Life Sciences and Social Sciences


- Table of hours of television watched per week: 11 15 24 34 36 22 20 30 12 32 24 36 42 36 42 26 37 39 48 35 26 29 27 81276 40 54 47 KARKE 31 35 42 75 35 46 36 42 65 28 54 65 28 23 28 23669 34 43 35 36 16 19 19 28212 Using the data above, construct a frequency table according the following classes: Number of Hours Frequency Relative Frequency 10-19 20-29 |30-39 40-49 50-59 60-69 70-79 80-89 From the frequency table above, find a) the lower class limits b) the upper class limits c) the class width d) the class boundaries Statistics 300 Frequency Tables and Pictures of Data, page 2 Using your frequency table, construct a frequency and a relative frequency histogram labeling both axes.arrow_forwardTable of hours of television watched per week: 11 15 24 34 36 22 20 30 12 32 24 36 42 36 42 26 37 39 48 35 26 29 27 81276 40 54 47 KARKE 31 35 42 75 35 46 36 42 65 28 54 65 28 23 28 23669 34 43 35 36 16 19 19 28212 Using the data above, construct a frequency table according the following classes: Number of Hours Frequency Relative Frequency 10-19 20-29 |30-39 40-49 50-59 60-69 70-79 80-89 From the frequency table above, find a) the lower class limits b) the upper class limits c) the class width d) the class boundaries Statistics 300 Frequency Tables and Pictures of Data, page 2 Using your frequency table, construct a frequency and a relative frequency histogram labeling both axes.arrow_forwardA study was undertaken to compare respiratory responses of hypnotized and unhypnotized subjects. The following data represent total ventilation measured in liters of air per minute per square meter of body area for two independent (and randomly chosen) samples. Analyze these data using the appropriate non-parametric hypothesis test. Unhypnotized: 5.0 5.3 5.3 5.4 5.9 6.2 6.6 6.7 Hypnotized: 5.8 5.9 6.2 6.6 6.7 6.1 7.3 7.4arrow_forward
- 13arrow_forward7arrow_forwardEvaluate the double integral ' √ √ (−2xy² + 3ry) dA R where R = {(x,y)| 1 ≤ x ≤ 3, 2 ≤ y ≤ 4} Double Integral Plot of integrand and Region R N 120 100 80- 60- 40 20 -20 -40 2 T 3 4 5123456 This plot is an example of the function over region R. The region and function identified in your problem will be slightly different. Answer = Round your answer to four decimal places.arrow_forward
- Find the values of p for which the series is convergent. P-?- ✓ 00 Σ nº (1 + n10)p n = 1 Need Help? Read It Watch It SUBMIT ANSWER [-/4 Points] DETAILS MY NOTES SESSCALCET2 8.3.513.XP. Consider the following series. 00 Σ n = 1 1 6 n° (a) Use the sum of the first 10 terms to estimate the sum of the given series. (Round the answer to six decimal places.) $10 = (b) Improve this estimate using the following inequalities with n = 10. (Round your answers to six decimal places.) Sn + + Los f(x) dx ≤s ≤ S₁ + Jn + 1 + Lo f(x) dx ≤s ≤ (c) Using the Remainder Estimate for the Integral Test, find a value of n that will ensure that the error in the approximation s≈s is less than 0.0000001. On > 11 n> -18 On > 18 On > 0 On > 6 Need Help? Read It Watch Itarrow_forward√5 Find Lª³ L² y-are y- arctan (+) dy dydx. Hint: Use integration by parts. SolidUnderSurface z=y*arctan(1/x) Z1 2 y 1 1 Round your answer to 4 decimal places.arrow_forwardFor the solid lying under the surface z = √√4-² and bounded by the rectangular region R = [0,2]x[0,2] as illustrated in this graph: Double Integral Plot of integrand over Region R 1.5 Z 1- 0.5- 0 0.5 1 1.5 205115 Answer should be in exact math format. For example, some multiple of .arrow_forward
 Algebra & Trigonometry with Analytic GeometryAlgebraISBN:9781133382119Author:SwokowskiPublisher:Cengage
 Trigonometry (MindTap Course List)TrigonometryISBN:9781305652224Author:Charles P. McKeague, Mark D. TurnerPublisher:Cengage Learning
 Holt Mcdougal Larson Pre-algebra: Student Edition...AlgebraISBN:9780547587776Author:HOLT MCDOUGALPublisher:HOLT MCDOUGAL
 Mathematics For Machine TechnologyAdvanced MathISBN:9781337798310Author:Peterson, John.Publisher:Cengage Learning,
 Algebra: Structure And Method, Book 1AlgebraISBN:9780395977224Author:Richard G. Brown, Mary P. Dolciani, Robert H. Sorgenfrey, William L. ColePublisher:McDougal Littell
 Trigonometry (MindTap Course List)TrigonometryISBN:9781337278461Author:Ron LarsonPublisher:Cengage Learning