
the graph of the equation and then find the domain and range.
The equation
Given information:
The equation is:
Concept Used:
The domain of a graph consits of all the input values shown on the x -axis and the range is the set of possible output values which are shown on the y -axis.
Calculation:
Take the given equation,
This can be written as in below.
This equation shows the equation of hyperbola with center
Graph:
Make a table of values of x and y .
Now, sketch the graph of the equation
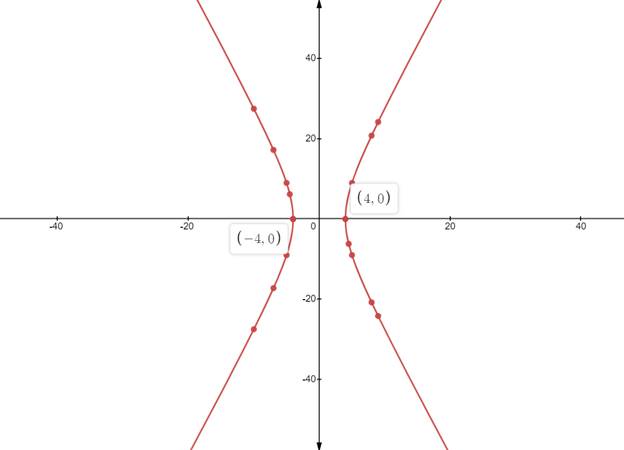
This graph represents a hyperbola with center
It has two lines of symmetry, the x -axis and the y -axis.
The domain is the the set of real numbers
The range is the set of all real numbers.
Chapter 10 Solutions
High School Math 2015 Common Core Algebra 2 Student Edition Grades 10/11

 Algebra and Trigonometry (6th Edition)AlgebraISBN:9780134463216Author:Robert F. BlitzerPublisher:PEARSON
 Contemporary Abstract AlgebraAlgebraISBN:9781305657960Author:Joseph GallianPublisher:Cengage Learning
 Linear Algebra: A Modern IntroductionAlgebraISBN:9781285463247Author:David PoolePublisher:Cengage Learning
 Algebra And Trigonometry (11th Edition)AlgebraISBN:9780135163078Author:Michael SullivanPublisher:PEARSON
 Introduction to Linear Algebra, Fifth EditionAlgebraISBN:9780980232776Author:Gilbert StrangPublisher:Wellesley-Cambridge Press
 College Algebra (Collegiate Math)AlgebraISBN:9780077836344Author:Julie Miller, Donna GerkenPublisher:McGraw-Hill Education