
Concept explainers
Videos
Testing for a
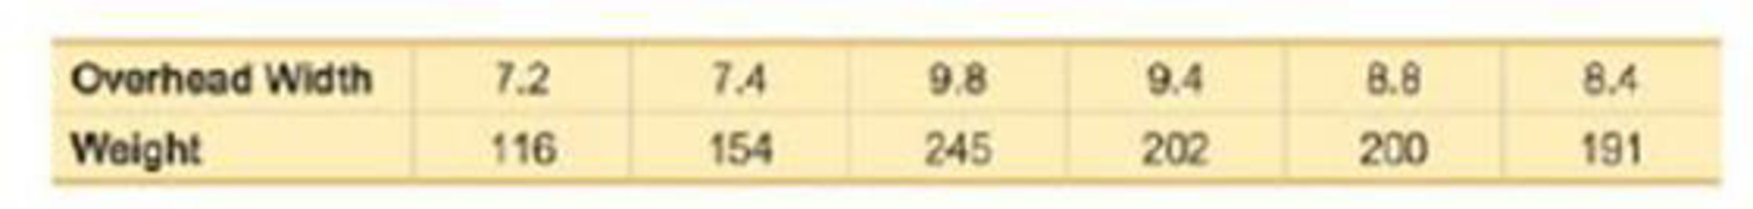
23. Weighing Seals with a Camera Listed below are the overhead widths (cm) of seals measured from photographs and the weights (kg) of the seals (based on “Mass Estimation of Weddell Seals Using Techniques of Photogrammetry” by R. Garrott of Montana State University). The purpose of the study was to determine if weights of seals could he determined from overhead photographs. Is there sufficient evidence to conclude that there is a linear correlation between overhead widths of seals from photographs and the weights of the seals?
Want to see the full answer?
Check out a sample textbook solution
Chapter 10 Solutions
ELEM.STAT.(LL)-W/MYLAB+ETEXT 18WKS


- Testing for a Linear Correlation. In Exercises 13–28, construct a scatterplot, and find the value of the linear correlation coefficient r. Also find the P-value or the critical values of r from Table A-6. Use a significance level of α = 0.05. Determine whether there is sufficient evidence to support a claim of a linear correlation between the two variables. (Save your work because the same data sets will be used in Section 10-2 exercises.) Tips Listed below are amounts of bills for dinner and the amounts of the tips that were left. The data were collected by students of the author. Is there sufficient evidence to conclude that there is a linear correlation between the bill amounts and the tip amounts? If everyone were to tip with the same percentage, what should be the value of r?arrow_forwardTesting for a Linear Correlation. In Exercises 13–28, construct a scatterplot, and find the value of the linear correlation coefficient r. Also find the P-value or the critical values of r from Table A-6. Use a significance level of α = 0.05. Determine whether there is sufficient evidence to support a claim of a linear correlation between the two variables. (Save your work because the same data sets will be used in Section 10-2 exercises.) Revised mpg Ratings Listed below are combined city-highway fuel economy ratings (in mi/gal) for different cars. The old ratings are based on tests used before 2008 and the new ratings are based on tests that went into effect in 2008. Is there sufficient evidence to conclude that there is a linear correlation between the old ratings and the new ratings? What do the data suggest about the old ratings?arrow_forwardTesting for a Linear Correlation. In Exercises 13–28, construct a scatterplot, and find the value of the linear correlation coefficient r. Also find the P-value or the critical values of r from Table A-6. Use a significance level of α = 0.05. Determine whether there is sufficient evidence to support a claim of a linear correlation between the two variables. (Save your work because the same data sets will be used in Section 10-2 exercises.) Manatees Listed below are numbers of registered pleasure boats in Florida (tens of thousands) and the numbers of manatee fatalities from encounters with boats in Florida for each of several recent years. The values are from Data Set 10 “Manatee Deaths” in Appendix B. Is there sufficient evidence to conclude that there is a linear correlation between numbers of registered pleasure boats and numbers of manatee boat fatalities?arrow_forward
- Testing for a Linear Correlation. In Exercises 13–28, construct a scatterplot, and find the value of the linear correlation coefficient r. Also find the P-value or the critical values of r from Table A-6. Use a significance level of α = 0.05. Determine whether there is sufficient evidence to support a claim of a linear correlation between the two variables. (Save your work because the same data sets will be used in Section 10-2 exercises.) POTUS Media periodically discuss the issue of heights of winning presidential candidates and heights of their main opponents. Listed below are those heights (cm) from several recent presidential elections (from Data Set 15 “Presidents” in Appendix B). Is there sufficient evidence to conclude that there is a linear correlation between heights of winning presidential candidates and heights of their main opponents? Should there be such a correlation?arrow_forwardThe correlation coefficient, r, developed by Karl Pearson in the early 1900s, is numerical and provides a measure of strength and direction of the linear association between the independent variable x and the dependent variable y. Group of answer choices True Falsearrow_forwardSolve for the following: Expressed final answers in 4-decimal places. Compute for the coefficient of correlation coefficient and interpret its meaning.arrow_forward
- Interpreting a Computer Display. In Exercises 5–8, we want to consider the correlation between heights of fathers and mothers and the heights of their sons. Refer to the StatCrunch display and answer the given questions or identify the indicated items. The display is based on Data Set 5 “Family Heights” in Appendix B. Height of Son A son will be bom to a father who is 70 in. tall and a mother who is 60 in. tall. Use the multiple regression equation to predict the height of the son. Is the result likely to be a good predicted value? Why or why not?arrow_forwardFind the correlation coefficient r for the given set of data. x y 2 9 4 11 5 19 7 23 How do you come to this conclusion?arrow_forwardA study of emergency service facilities investigated the relationship between the number of facilities and the average distance traveled to provide the emergency service. The following table gives the data collected. Number ofFacilities AverageDistance(miles) 9 1.65 11 1.11 16 0.83 21 0.62 27 0.51 30 0.48 (a) Develop a scatter diagram for these data, treating average distance traveled as the dependent variable. A scatter diagram has 6 points. The horizontal axis ranges from 0 to 1.8 and is labeled: Distance. The vertical axis ranges from 5 to 35 and is labeled: Number. Moving from left to right, the leftmost point is at approximately (0.48, 30), with the next five points extending downward. The points decrease steeply at first and then level off. A scatter diagram has 6 points. The horizontal axis ranges from 5 to 35 and is labeled: Number. The vertical axis ranges from 0 to 1.8 and is labeled: Distance. Moving from left to right, the leftmost point is at…arrow_forward
- A study of emergency service facilities investigated the relationship between the number of facilities and the average distance traveled to provide the emergency service. The following table gives the data collected. Number ofFacilities AverageDistance(miles) 9 1.65 11 1.11 16 0.83 21 0.62 27 0.51 30 0.48 (a) Develop a scatter diagram for these data, treating average distance traveled as the dependent variable. A scatter diagram has 6 points. The horizontal axis ranges from 0 to 1.8 and is labeled: Distance. The vertical axis ranges from 5 to 35 and is labeled: Number. Moving from left to right, the leftmost point is at approximately (0.48, 30), with the next five points extending downward. The points decrease steeply at first and then level off. A scatter diagram has 6 points. The horizontal axis ranges from 5 to 35 and is labeled: Number. The vertical axis ranges from 0 to 1.8 and is labeled: Distance. Moving from left to right, the leftmost point is at…arrow_forwardStatistical technique used to determine the degree to which two variables are related is known as a. Regression b. Correlation c. None of these d. Dispersionarrow_forwardPART A. Solve for the Pearson Product-Moment Coefficient of Correlation. 24 43 34 76 54 87 90 Y 34 65 56 34 90 65 47arrow_forward
 Big Ideas Math A Bridge To Success Algebra 1: Stu...AlgebraISBN:9781680331141Author:HOUGHTON MIFFLIN HARCOURTPublisher:Houghton Mifflin Harcourt
 Glencoe Algebra 1, Student Edition, 9780079039897...AlgebraISBN:9780079039897Author:CarterPublisher:McGraw Hill