Videos
Safegate Foods, Inc., is redesigning the checkout lanes in its supermarkets throughout the country and is considering two designs. Tests on customer checkout times conducted at two stores where the two new systems have been installed result in the following summary of the data.
| System A | System B |
| n1 = 120 | n2 = 100 |
|
|
|
| σ1 = 2.2 minutes | σ2 = 1.5 minutes |
Test at the .05 level of significance to determine whether the population
Test whether the population mean checkout times of the two systems differ at .05 level of significance or not.
Suggest the preferable system.
Answer to Problem 38SE
There is sufficient evidence to conclude that, there is a difference between the population mean checkout times of the two systems.
The preferable system is system A.
Explanation of Solution
Calculation:
The results of the tests on customer checkout times at system A and system B are as follows:
| System A | System B |
The level of significance is
State the hypothesis:
The test hypotheses are as follows:
Null hypothesis:
That is, there is no difference between the population mean checkout times of the two systems.
Alternative hypothesis:
That is, there is difference between the population mean checkout times of the two systems.
Test statistic:
The test statistic for hypothesis tests about
Substitute
Thus, the test statistic is 2.79.
Software procedure:
Step-by-step software procedure to obtain the mean using MINITAB software is as follows,
- Choose Graph > Probability Distribution Plot choose View Probability > OK.
- From Distribution, choose ‘Normal’ distribution.
- Click the Shaded Area tab.
- Choose X Value and Two Tail for the region of the curve to shade.
- Enter the data value as 2.79.
- Click OK.
Output using MINITAB software is as follows:
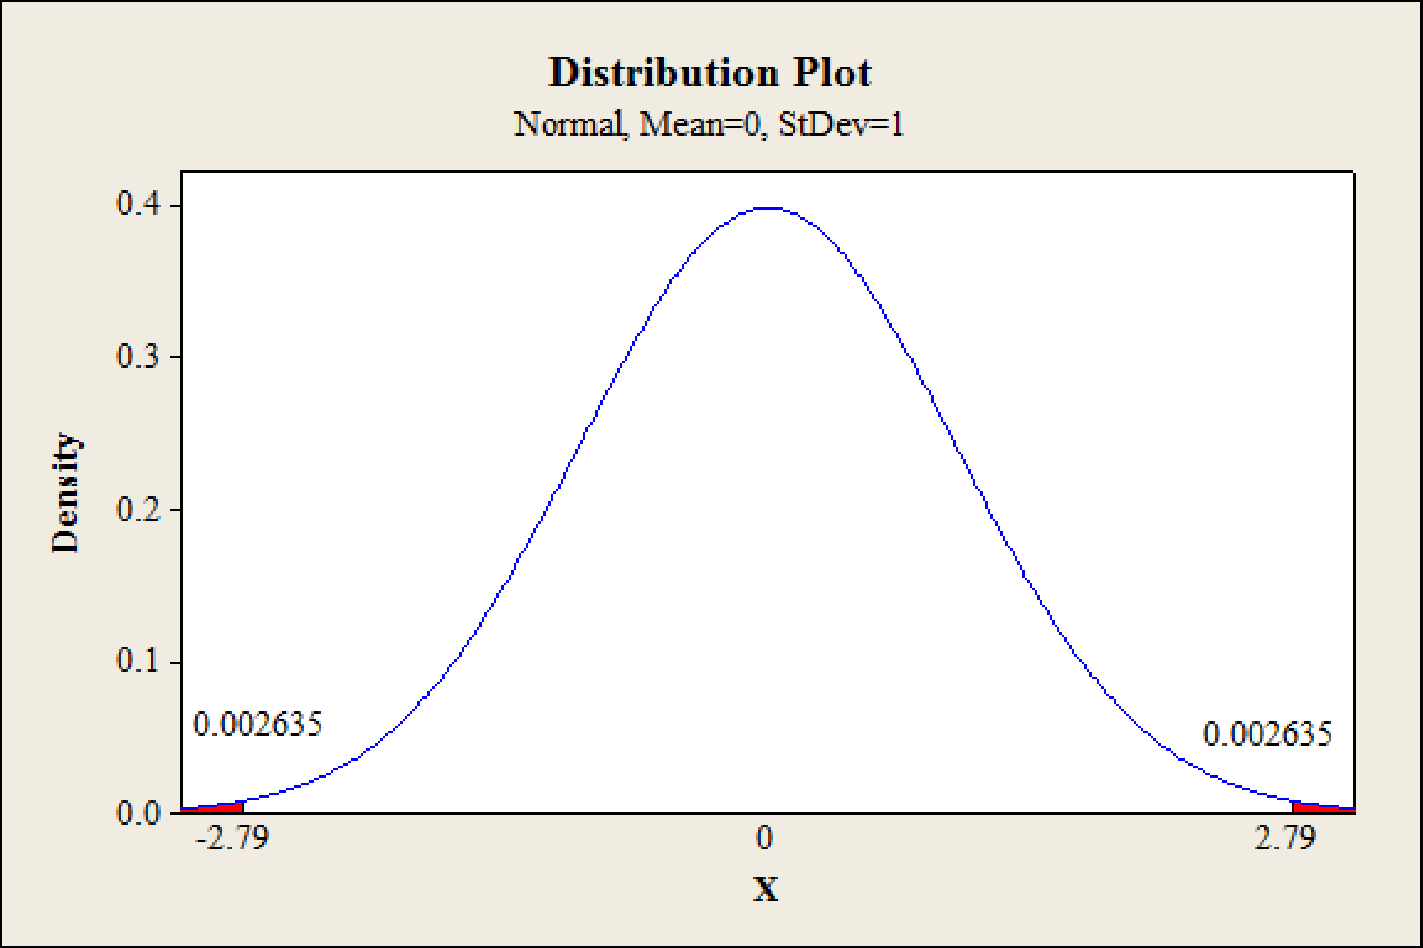
Thus, the p-value is 0.0052
Decision rule based on p-value approach:
If p-value ≤ α, then reject the null hypothesis H0.
If p-value > α, then fail to reject the null hypothesis H0.
Conclusion:
Here, the p-value 0.0052 is less than or equal to the significance level 0.05.
That is,
Thus, the null hypothesis is rejected.
Therefore, there is sufficient evidence to conclude that, there is a difference between the population mean checkout times of the two systems.
Thus, there is a difference between the population mean checkout times of the two systems.
Here the mean checkout time of system B is less when compared to the mean checkout time of system A.
Therefore, system A is preferable.
Want to see more full solutions like this?
Chapter 10 Solutions
EBK STATISTICS FOR BUSINESS & ECONOMICS


 Linear Algebra: A Modern IntroductionAlgebraISBN:9781285463247Author:David PoolePublisher:Cengage Learning
 Calculus For The Life SciencesCalculusISBN:9780321964038Author:GREENWELL, Raymond N., RITCHEY, Nathan P., Lial, Margaret L.Publisher:Pearson Addison Wesley,
 Big Ideas Math A Bridge To Success Algebra 1: Stu...AlgebraISBN:9781680331141Author:HOUGHTON MIFFLIN HARCOURTPublisher:Houghton Mifflin Harcourt
 Glencoe Algebra 1, Student Edition, 9780079039897...AlgebraISBN:9780079039897Author:CarterPublisher:McGraw Hill