Videos
Effect of Paternal Grandmother's Food Supply on Infant Mortality Widely available historical data on periods of famine show that before the industrial revolution, a failed harvest in one autumn often led to severe food shortages the following winter. Retrospective studies have correlated infant mortality with the abundance or food during a grandparent's child hood. FIGURE 10.11 shows results from one or these studies.
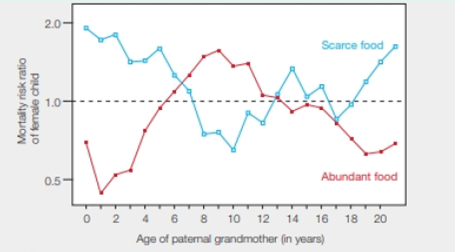
FIGURE 10.11 Relative risk of early death of female child, correlated with the age at which her paternal grandmother experienced a winter with a food supply, that was scarce (blue) or abundant (red) during childhood. The dotted line represents no difference in risk of mortality. A value above the line means increased risk; one below the line indicates reduced risk.
Compare the mortality risk of girls whose paternal grandmothers ate well at age 2 with girls whose grandmothers experienced famine at the same age. Which girl was more likely to die early? How much more likely was she to die?
To compare: The mortality risk of girls with the food habit of their parental grandmothers.
Introduction: The parental eating behavior has a great influence on the mortality rate of the offspring. The survival of the humans is greatly affected by the food scarcity faced by their ancestors. An individual who has faced famine or starvation at a particular period can be correlated with the infant mortality rate.
Explanation of Solution
As given in Fig. 10.11, “Relative risk of early death of a female child” can be correlated with the age of her parental grandmother food scarcity or food abundance.
According to the given data, during the industrial revolution, a food shortage was experienced in winter due to the failure in harvesting in the autumn season.
The given graph shows, the age of parental grandmother in X- axis and mortality risk ratio of the female child in the Y- axis. The blue line in the graph depicts the mortality rate and parental grandmother who faced food scarcity at the different age. And the red line in the graph depicts the mortality rate and parental grandmother who has abundant of food at the different age. A dotted line which given in the graph represents that there is no difference in the risk of mortality. If the value goes above the dotted line, the risk increases and value below the line the risk decreases.
A comparison is done between the mortality risks of girls correlated with the eating habits of their parental grandmother at the age 2. According to the given graph, a girl whose grandmother experienced food crisis at the age of two is more likely to die earlier than the girl whose parental grandmother got abundant food at the age of 2. The female grandchild’s mortality risk ratio is one and one and half time greater than the average.
The girl child whose parental grandmother faced food crisis at age 2 is one and one-half times more likely to die early.
Want to see more full solutions like this?
Chapter 10 Solutions
Biology: The Unity and Diversity of Life (MindTap Course List)
Additional Science Textbook Solutions
SEELEY'S ANATOMY+PHYSIOLOGY
Campbell Biology in Focus (2nd Edition)
Campbell Biology in Focus
Human Anatomy
Essentials of Human Anatomy & Physiology (12th Edition)
Laboratory Experiments in Microbiology (11th Edition)


- Mortality due to lung cancer was followed in groups of males in the UnitedKingdom for 50 years. Figure 20–3 shows the cumulative risk of dying from lung cancer as a function of age and smoking habits for four groups of males: those who never smoked, those who stopped at age 30, those who stopped at age 50, and those who continued to smoke. These data show clearly that individuals can substantially reduce their cumulative risk of dying from lung cancer by stopping smoking. What do you suppose is the biological basis for this observation?arrow_forwardWhat are the three (3) leading causes of infant mortality For each leading cause, suggest two (2) or more public health measures aimed at reducing the risk.arrow_forwardTrue or False. Explain maximun of 2 sentences. a. During embryo maturation, ABA levels decrease to prevent vivipary.b. Ripening of strawberry and pommelo is characterized by an increase in ethylene and a burst of CO2 production.arrow_forward
- The effect of time (hours) on the mortality (%) of three species of Chironomus larvae exposed to oxygen-free water at a temperature of 20 °C. The table shows the results of five separate experiments conducted on each species of midge.(Species are fictitious) Question 1.3. Plot a graph showing the average percent survival of each midge species (all three species on one graph) against time in oxygen-free water. Label the axes and provide a clear legend.arrow_forwardPhenylketonuria is a recessive autosomal genetic disorder that can cause mental retardation. Phenylketonuria is particularly common in Turkey, where 1 in 2600 children are born with the disease. As of 2011, the population of Turkey was 73.6 million. Based on this data, and assuming that the Turkish population is in Hardy-Weinberg equilibrium. (a) Estimate the number of carriers of phenylketonuria in Turkey (b) Estimate the proportion of unaffected individuals who are carriers.arrow_forwardThe earliest study reported here showed the negative effects of the cash and carry system. How has the introduction of the Ghana health insurance program affected quality, both negatively and positivelyarrow_forward
- Which of the following statements about the grandmother hypothesis is correct? This is a hypothesis used to explain why grandmothers tend to live longer than grandfathers. For this hypothesis to work, a grandmother will need to have an antagonistic pleiotropic mutation that extends her lifespan but also lessens her physical activities. Because grandmothers are older, so they tend to contribute less in a family. That is, grandmothers are usually a drain of resources for a family. The evolution of monthly menstrual cycle in human females is seen as an example explained by the grandmother hypothesis. None of the abovearrow_forwardSuppose Inverness was considering offering a special add-on to its standard Dental insurance. For an additional 1 dollar a month a family could be fully covered for professional teeth whitening, something that normally would cost five thousand dollars a treatment. The whitening procedure would erase any stains that build up over time as a result of drinking too much coffee. Would this benefit create an adverse selection and/or moral hazard problem? If so explain why, and how the benefit could be better designed to address these issues.arrow_forwardGive typing answer with explanation and conclusion 6. In a prospective cohort study, it is found that men who drink alcoholic beverages are more likely to develop lung cancer than men who are not drinkers. However, among smokers the risk for lung cancer among drinkers and nondrinkers is the same. Also, among nonsmokers the risk for lung cancer among drinkers and nondrinkers is the same. In this example, smoking is a(n): a. Confounding variable b. Effect modifier c. Neither of the abovearrow_forward
- Please help with the following: Prior to approximately 12 KYA, humans were hunter-gatherers and relied on wild plants and animals for subsistence. This means that their conscious manipulation of the genomes and gene pools of other organisms was essentially non-existent. 12KYA signaled the beginning of plant and animal domestication efforts. A. Two true statements; one false statement B. Two false statements; one true statement C. All True statements D. All False statements E. None of the abovearrow_forwardBeige and black rabbits were introduced into two meadows. One meadow predominantly consists of volcanic soil and the other predominantly consists of clay soil. Each rabbit was marked with a dot of blue paint and the pad of his foot. The number of rabbits released and recaptured one month later are shown in the table below. Assume the number of rabbits recaptured is a direct reflection of the number of rabbits surviving. Using the data below, what conclusions can you make regarding the color of rabbits and their survival in different soil types? VOLCANIC SOIL # released #recaptures % precentage beige rabbits 137 18 13.1% black rabbits 447 123 27.5% CLAY SOIL # released # recaptures % precentage beige rabbits 393 54 13.1% black rabbits 406 19 4.7%arrow_forwardWhen people move to hot climates, their bodies increase sweat production to manage the heat-induced body stress. This increase in sweat production is passed on to their offspring. In other words, their offspring would display high sweat production as a result of descending from high sweat-producing parents. Question 3 a. True b. Falsearrow_forward
 Nutrition Through The Life CycleHealth & NutritionISBN:9781337919333Author:Brown, Judith E.Publisher:Cengage Learning,
 Understanding Nutrition (MindTap Course List)Health & NutritionISBN:9781337392693Author:Eleanor Noss Whitney, Sharon Rady RolfesPublisher:Cengage Learning