
Concept explainers
Videos
In a classic study in the area of problem solving Katona (1940) compared the effectiveness of two methods of instruction. One group of participants was shown the exact, step-by-step procedure for solving a problem and was required to memorize the solution. Participants in a second group were encouraged to study the problem and find the solution on their own. They were given helpful hints and clues, but the exact solution was never explained. The study included the problem in the following figure showing a pattern of five squares made of match sticks. The problem is to change the pattern into exactly four squares by moving only three matches. (All matches must be used, none can be removed, and all the squares must be the same size.) After three weeks, both groups returned to be tested again. The two groups did equally well on the matchstick problem they had learned curlier. But when they were given new problems (similar to the matchstick problem), the memorization group had much lower scores than the group who explored and found the solution on their own. The following data demonstrate this result.
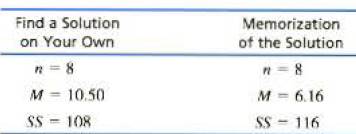
- a. Is there a significant difference in performance on new problems for these two groups? Use a two-tailed test with α = .05.
- b. Construct a 90% confidence
interval to estimate the size of the mean difference.
Want to see the full answer?
Check out a sample textbook solution
Chapter 10 Solutions
LMS Integrated MindTap Psychology, 1 term (6 months) Printed Access Card for Gravetter/Wallnau/Forzano's Essentials of Statistics for the Behavioral Sciences, 9th


- On a 40-question final exam in history the problems are split between true/false questions and multiple-choice problems in the ratio of 3 to 5. Find the number of each type of problem.arrow_forwardCheck Yourself! Solve the given problem: 1. In an attempt to assess the effect of the length of time spent in using social media to the academic performance of the student, a survey was conducted to ten randomly selected students to determine the number of minutes per week using social media and their scores in a department examination in mathematic which consists of a 50-item test. The data are as follows: Minutes spent using social media per week (x) Score in the department exam (y) 30 45 45 48 60 120 180 200 240 300 320 400 a. Compute for the correlation coefficient r. b. Compute for the value of m and b. c. Form the regression equation 42 40 38 43 20 29 35 15arrow_forwardPlease answer the question in the photo. Thank you!arrow_forward
- Solve the given problem: 1. In an attempt to assess the effect of the length of time spent in using social media to the academic performance of the student, a survey was conducted to ten randomly selected students to determine the number of minutes per week using social media and their scores in a department examination in mathematie which consists of a 50-item test. The data are as follows: Minutes spent using social media per week (x) Score in the department exam (y) 30 45 45 48 60 42 120 40 180 38 200 43 240 20 300 29 320 35 400 15 a. Compute for the correlation coefficient r. b. Compute for the value of m and b. c. Form the regression equationarrow_forwardA study was developed to evaluate effectiveness of a weight loss diet plan. An ad was placed in two towns to locate study participants who were to follow the diet. In Town A, the clinicians asked each dieter to report how much weight they had lost over the previous 6 weeks while following the diet. In Town B, the clinicians weighed each dieter at the beginning of the study and again after 6 weeks on the diet program. The weight lost was calculated as the difference between the beginning weight and the weight after 6 weeks. At the end of the study, it was determined that Town B had lost significantly less weight than Town A. 1.What is the population of interest in this situation? 2. Identify source(s) of bias in this study.arrow_forwardPROBLEM: Seven eighth graders at Kay-Anlog Elementary School measured how far they could push the shot-put with their dominant (writing) hand and their weaker (non-writing) hand. They thought that they could push equal distances with either hand. The data were collected and recorded in this table. Distance (in feet) using Student 1 Student 2 Student 3 Student 4 Student 5 Student 6 Student 7 Dominant Hand 30 26 34 17 19 26 20 Weaker Hand 28 14 27 18 17 26 16 Provide answers to the following: State the null and alternative hypotheses Locate the critical region Calculate the t statistic Make a decision whether to accept or reject the null hypothesis Please refer to the formulas on the ppt uploaded in gclass.arrow_forward
- Solve.arrow_forwardSolve the given problem. Show solutions if solved manually or show the Excel computation results. PROBLEM :The amount spent on medical expenses per day is correlated with other health factors for 5 adult males. A study came up with the following table:Medical amount spentcost for alcohol weight Age2100 200 185 502378 250 200 421657 100 175 372584 200 225 542658 250 220 32 1. Which of the factors has a significant effect on medical expenses?2. Create the regression equation for the problem.arrow_forwardIdentify each step in Poyla’s Four Step process for Problem Solving.arrow_forward
 Intermediate AlgebraAlgebraISBN:9781285195728Author:Jerome E. Kaufmann, Karen L. SchwittersPublisher:Cengage Learning
 Algebra for College StudentsAlgebraISBN:9781285195780Author:Jerome E. Kaufmann, Karen L. SchwittersPublisher:Cengage Learning
 Algebra: Structure And Method, Book 1AlgebraISBN:9780395977224Author:Richard G. Brown, Mary P. Dolciani, Robert H. Sorgenfrey, William L. ColePublisher:McDougal Littell