
Concept explainers
Videos
For Exercises 1 through 7, do a complete
a. Draw the
b. Compute the value of the
c. Test the significance of the correlation coefficient at α = 0.01, using Table I.
d. Determine the regression line equation if r is significant.
e. Plot the regression line on the scatter plot, if appropriate.
f. Predict y′ for a specific value of x, if appropriate.
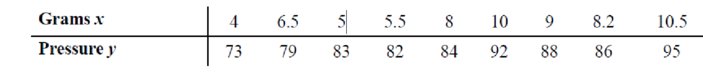
6. Protein and Diastolic Blood Pressure A study was conducted with vegetarians to see whether the number of grams of protein each ate per day was related to diastolic blood pressure. The data are given here. If there is a significant relationship, predict the diastolic pressure of a vegetarian who consumes 8 grams of protein per day. (This information will be used for Exercises 10 and 12.)
a.
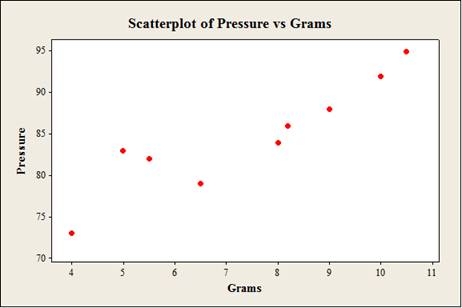
To construct: The scatterplot for the variables the number of grams of protein and the diastolic blood pressure.
Answer to Problem 10.1.6RE
Output using the MINITAB software is given below:
Explanation of Solution
Given info:
The data shows the number of grams of protein (x) and the diastolic blood pressure (y) values.
Calculation:
Step by step procedure to obtain scatterplot using the MINITAB software:
- Choose Graph > Scatterplot.
- Choose Simple and then click OK.
- Under Y variables, enter a column of Pressure.
- Under X variables, enter a column of Grams.
- Click OK.
b.
To compute: The value of the correlation coefficient.
Answer to Problem 10.1.6RE
The value of the correlation coefficient is 0.916.
Explanation of Solution
Calculation:
Correlation coefficient r:
Software Procedure:
Step-by-step procedure to obtain the ‘correlation coefficient’ using the MINITAB software:
- Select Stat > Basic Statistics > Correlation.
- In Variables, select x and y from the box on the left.
- Click OK.
Output using the MINITAB software is given below:
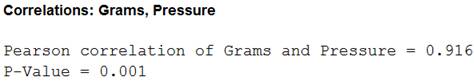
From the MINITAB output, the value of the correlation is 0.916.
c.
To test: The significance of the correlation coefficient at
Answer to Problem 10.1.6RE
The conclusion is that, there is a linear relation between the number of grams of protein and the diastolic blood pressure.
Explanation of Solution
Given info:
The level of significance is
Calculation:
The hypotheses are given below:
Null hypothesis:
That is, there is no linear relation between the number of grams of protein and the diastolic blood pressure.
Alternative hypothesis:
That is, there is a linear relation between the number of grams of protein and the diastolic blood pressure.
The sample size is 9.
The formula to find the degrees of the freedom is
That is,
From the “TABLE –I: Critical Values for the PPMC”, the critical value for 7 degrees of freedom and
Rejection Rule:
If the absolute value of r is greater than the critical value then reject the null hypothesis.
Conclusion:
From part (b), the value of r is 0.916 that is the absolute value of r is 0.916.
Here, the absolute value of r is greater than the critical value
That is,
By the rejection rule, reject the null hypothesis.
There is a sufficient evidence to support the claim that “there is a linear relation between the number of grams of protein and the diastolic blood pressure.
d.
To find: The regression equation for the given data.
Answer to Problem 10.1.6RE
The regression equation for the given data is
Explanation of Solution
Calculation:
Regression:
Software procedure:
Step by step procedure to obtain the regression equation using the MINITAB software:
- Choose Stat > Regression > Regression.
- In Responses, enter the column of Pressure.
- In Predictors, enter the column of Grams.
- Click OK.
Output using the MINITAB software is given below:
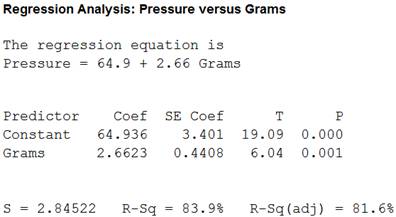
Thus, regression equation for the given data is
e.
To construct: The scatterplot for the variables the speed and time with regression line.
Answer to Problem 10.1.6RE
Output using the MINITAB software is given below:

Explanation of Solution
Calculation:
Step by step procedure to obtain scatterplot using the MINITAB software:
- Choose Graph > Scatterplot.
- Choose with line and then click OK.
- Under Y variables, enter a column of Pressure.
- Under X variables, enter a column of Grams.
- Click OK.
f.
To obtain: The predicted value of the diastolic pressure of a vegetarian who consumes 8 grams of protein per day.
Answer to Problem 10.1.6RE
The predicted value of the diastolic pressure of a vegetarian is 86.232.
Explanation of Solution
Calculation:
Thus, regression equation for the given data is
Substitute x as 8 in the regression equation
Thus, the predicted value of the diastolic pressure of a vegetarian is 86.232.
Want to see more full solutions like this?
Chapter 10 Solutions
ELEMENTARY STATISTICS W/CONNECT >IP<


- Find the equation of the regression line for the following data set. x 1 2 3 y 0 3 4arrow_forwardFor the following exercises, consider the data in Table 5, which shows the percent of unemployed ina city of people 25 years or older who are college graduates is given below, by year. 40. Based on the set of data given in Table 6, calculate the regression line using a calculator or other technology tool, and determine the correlation coefficient to three decimal places.arrow_forwardFor the following exercises, consider the data in Table 5, which shows the percent of unemployed in a city ofpeople25 years or older who are college graduates is given below, by year. 41. Based on the set of data given in Table 7, calculatethe regression line using a calculator or othertechnology tool, and determine the correlationcoefficient to three decimal places.arrow_forward
 Functions and Change: A Modeling Approach to Coll...AlgebraISBN:9781337111348Author:Bruce Crauder, Benny Evans, Alan NoellPublisher:Cengage Learning
 Algebra & Trigonometry with Analytic GeometryAlgebraISBN:9781133382119Author:SwokowskiPublisher:Cengage
 Calculus For The Life SciencesCalculusISBN:9780321964038Author:GREENWELL, Raymond N., RITCHEY, Nathan P., Lial, Margaret L.Publisher:Pearson Addison Wesley,
 Glencoe Algebra 1, Student Edition, 9780079039897...AlgebraISBN:9780079039897Author:CarterPublisher:McGraw Hill
 Big Ideas Math A Bridge To Success Algebra 1: Stu...AlgebraISBN:9781680331141Author:HOUGHTON MIFFLIN HARCOURTPublisher:Houghton Mifflin Harcourt