
Concept explainers
Videos
For Exercises 1 through 7, do a complete
a. Draw the
b. Compute the value of the
c. Test the significance of the correlation coefficient at α = 0.01, using Table I.
d. Determine the regression line equation if r is significant.
e. Plot the regression line on the scatter plot, if appropriate.
f. Predict y′ for a specific value of x, if appropriate.
5. Typing Speed and Word Processing A researcher desires to know whether the typing speed of a secretary (in words per minute) is related to the time (in hours) that it takes the secretary to learn to use a new word processing program. The data are shown.

If there is a significant relationship, predict the time it will take the average secretary who has a typing speed of 72 words per minute to learn the word processing program. (This information will be used for Exercises 9 and 11.)
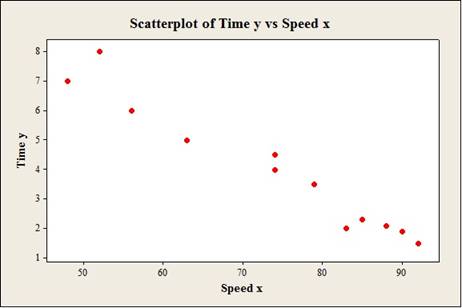
a.
To construct: The scatterplot for the variablesthe speed and time.
Answer to Problem 10.1.5RE
Output using the MINITAB software is given below:
Explanation of Solution
Given info:
The data shows the typing speed of a secretary (in words per minute) (x) and the time (in hours) (y) values.
Calculation:
Step by step procedure to obtain scatterplot using the MINITAB software:
- Choose Graph > Scatterplot.
- Choose Simple and then click OK.
- Under Y variables, enter a column ofTime.
- Under X variables, enter a column ofSpeed.
- Click OK.
b.
To compute: The value of the correlation coefficient.
Answer to Problem 10.1.5RE
The value of the correlation coefficientis –0.974.
Explanation of Solution
Calculation:
Correlation coefficient r:
Software Procedure:
Step-by-step procedure to obtain the ‘correlation coefficient’ using the MINITAB software:
- Select Stat >Basic Statistics > Correlation.
- In Variables, select x and y from the box on the left.
- Click OK.
Output using the MINITAB software is given below:
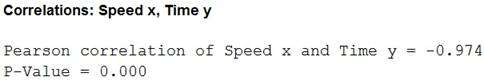
From the MINITAB output, the value of the correlation is –0.974.
c.
To test: The significance of the correlation coefficient at
Answer to Problem 10.1.5RE
The conclusion is that,there is a linear relation between the speed and time.
Explanation of Solution
Given info:
The level of significance is
Calculation:
The hypotheses are given below:
Null hypothesis:
That is, there is no linear relation betweenthe speed and time.
Alternative hypothesis:
That is, there is a linear relation between the speed and time.
The sample size is 12.
The formula to find the degrees of the freedom is
That is,
From the “TABLE –I: Critical Values for the PPMC”, the critical value for 10 degrees of freedom and
Rejection Rule:
If the absolute value of r is greater than the critical value then reject the null hypothesis.
Conclusion:
From part (b), the value of r is–0.974that is the absolute value of r is 0.974.
Here, the absolute value of r is greater than the critical value
That is,
By the rejection rule,reject the null hypothesis.
There is asufficient evidence to support the claim that “there is alinear relation betweenthespeed and time.
d.
To find: The regression equation for the given data.
Answer to Problem 10.1.5RE
The regression equation for the given datais
Explanation of Solution
Calculation:
Regression:
Software procedure:
Step by step procedure to obtain the regression equation using the MINITAB software:
- Choose Stat > Regression > Regression.
- In Responses, enter the column ofTime.
- In Predictors, enter the column ofSpeed.
- Click OK.
Output using the MINITAB software is given below:
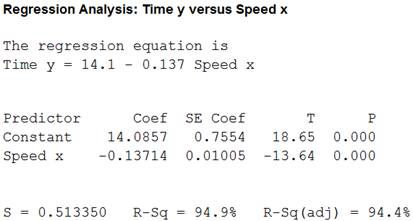
Thus, regression equation for the given datais
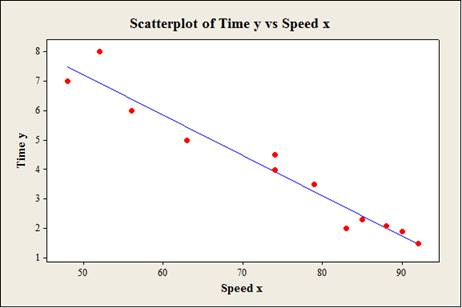
e.
To construct: The scatterplot for the variablesthe speed and time with regression line.
Answer to Problem 10.1.5RE
Output using the MINITAB software is given below:
Explanation of Solution
Calculation:
Step by step procedure to obtain scatterplot using the MINITAB software:
- Choose Graph > Scatterplot.
- Choose with line and then click OK.
- Under Y variables, enter a column of Time.
- Under X variables, enter a column ofSpeed.
- Click OK.
f.
To obtain: The predicted value of the time with speed of 72 words perminute.
Answer to Problem 10.1.5RE
Thepredicted value of the time is 4.726.
Explanation of Solution
Calculation:
Thus, regression equation for the given datais
Substitute x as 72 in the regression equation
Thus, the predicted value of the time is 4.726.
Want to see more full solutions like this?
Chapter 10 Solutions
ELEMENTARY STATS: STEP BY STEP - CONNECT


- Find the equation of the regression line for the following data set. x 1 2 3 y 0 3 4arrow_forwardFor the following exercises, consider the data in Table 5, which shows the percent of unemployed in a city ofpeople25 years or older who are college graduates is given below, by year. 41. Based on the set of data given in Table 7, calculatethe regression line using a calculator or othertechnology tool, and determine the correlationcoefficient to three decimal places.arrow_forwardFor the following exercises, consider the data in Table 5, which shows the percent of unemployed ina city of people 25 years or older who are college graduates is given below, by year. 40. Based on the set of data given in Table 6, calculate the regression line using a calculator or other technology tool, and determine the correlation coefficient to three decimal places.arrow_forward
- Life Expectancy The following table shows the average life expectancy, in years, of a child born in the given year42 Life expectancy 2005 77.6 2007 78.1 2009 78.5 2011 78.7 2013 78.8 a. Find the equation of the regression line, and explain the meaning of its slope. b. Plot the data points and the regression line. c. Explain in practical terms the meaning of the slope of the regression line. d. Based on the trend of the regression line, what do you predict as the life expectancy of a child born in 2019? e. Based on the trend of the regression line, what do you predict as the life expectancy of a child born in 1580?2300arrow_forwardFor the following exercises, use Table 4 which shows the percent of unemployed persons 25 years or older who are college graduates in a particular city, by year. Based on the set of data given in Table 5, calculate the regression line using a calculator or other technology tool, and determine the correlation coefficient. Round to three decimal places of accuracyarrow_forward
 Functions and Change: A Modeling Approach to Coll...AlgebraISBN:9781337111348Author:Bruce Crauder, Benny Evans, Alan NoellPublisher:Cengage Learning
 Calculus For The Life SciencesCalculusISBN:9780321964038Author:GREENWELL, Raymond N., RITCHEY, Nathan P., Lial, Margaret L.Publisher:Pearson Addison Wesley,
 Algebra & Trigonometry with Analytic GeometryAlgebraISBN:9781133382119Author:SwokowskiPublisher:Cengage
 Glencoe Algebra 1, Student Edition, 9780079039897...AlgebraISBN:9780079039897Author:CarterPublisher:McGraw Hill
 Big Ideas Math A Bridge To Success Algebra 1: Stu...AlgebraISBN:9781680331141Author:HOUGHTON MIFFLIN HARCOURTPublisher:Houghton Mifflin Harcourt