(a)
Interpretation:
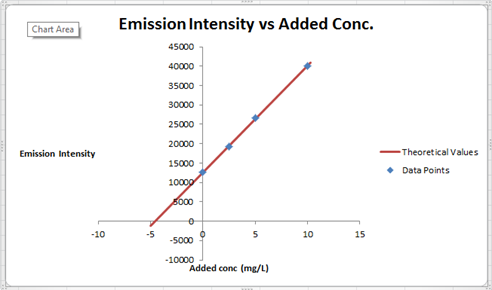
The least square analysis needs to be performed to determine the intercept, slopeand regression statistics, including the standard deviation about regression.
Concept introduction:
The least square analysis is defined as the method in which the final answer for the set of data points is calculated by the minimizing the summation of residue of set of data point from the given curve.
The equation for straight line is represented as follows:
Answer to Problem 10.11QAP
To satisfy the equation
Explanation of Solution
Least Square Analysis

The summary of calculation is as follows.
| Added Au | Emission Intensity (y) | ||
| 0 | 12568 | ||
| 2.5 | 19324 | ||
| 5 | 26622 | ||
| 10 | 40021 | ||
| m | c | 2752.72 | 12590.6 |
| sm | sb | 30.7796445 | 176.3126 |
| r2 | sy | 0.99975001 | 227.6185 |
Here, the sigma values focus on the errors present in the parameter.
So far, we have filled
Now, we must determine the concentration of gold and its uncertainty. The concentration of gold is x. intercept of the graph, because that is the point at which the gold is absence so the difference between that and the zero added point must be the gold concentration in sample.
Now, x is a function of c and m. Thus, the uncertainty in them will be propagated to x as well. We have the following since m and c are independent.
x = x(m,c)
By propagation of uncertainty,
This is, however, the standard error. Assuming the distribution of value to be normal about the value of x, this value would give an interval of 63.5% probability. However, if we want a 95% probability interval, we will have to multiply the error in x by 1.96.
(b)
Interpretation:
The concentration of gold in the sample solution in mg/L needs to be determined using the calculated values.
Concept introduction:
The least square analysis is defined as the method in which the final answer for the set of data points is calculated by the minimizing the summation of residue of set of data point from the given curve.
The equation for straight line is represented as follows:
Answer to Problem 10.11QAP
Concentration of gold in sample =
Explanation of Solution
Least Square Analysis

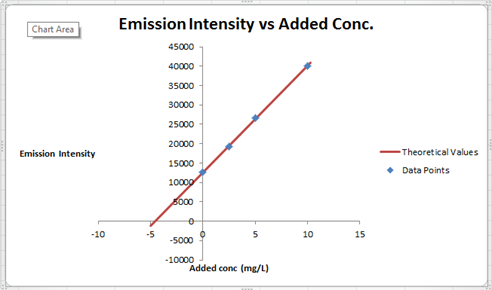
The summary of calculation is as follows.
| Added Au | Emission Intensity (y) | ||
| 0 | 12568 | ||
| 2.5 | 19324 | ||
| 5 | 26622 | ||
| 10 | 40021 | ||
| m | c | 2752.72 | 12590.6 |
| sm | sb | 30.7796445 | 176.3126 |
| r2 | sy | 0.99975001 | 227.6185 |
Here, the sigma values focus on the errors present in the parameter.
So far, we have filled
Now, we must determine the concentration of gold and its uncertainty. The concentration of gold is x. intercept of the graph, because that is the point at which the gold is absence so the difference between that and the zero added point must be the gold concentration in sample.
Now, x is a function of c and m. Thus, the uncertainty in them will be propagated to x as well. We have the following since m and c are independent.
x = x(m,c)
By propagation of uncertainty,
This is however, the standard error. Assuming the distribution of value to be normal about the value of x, this value would give an interval of 63.5% probability. However, if we want a 95% probability interval, we will have to multiply the error in x by 1.96.
Concentration of gold in sample =
(c)
Interpretation:
The concentration of gold in the sample is 8.51 mg/L needs to be determined and the hypothesis that the results equals the 95% confidence level needs to be tested.
Concept introduction:
The least square analysis is defined as the method in which the final answer for the set of data points is calculated by the minimizing the summation of residue of set of data point from the given curve.
The equation for straight line is represented as follows:
Answer to Problem 10.11QAP
Considering a confidence interval of 95% we have concentration of
Explanation of Solution
Least Square Analysis

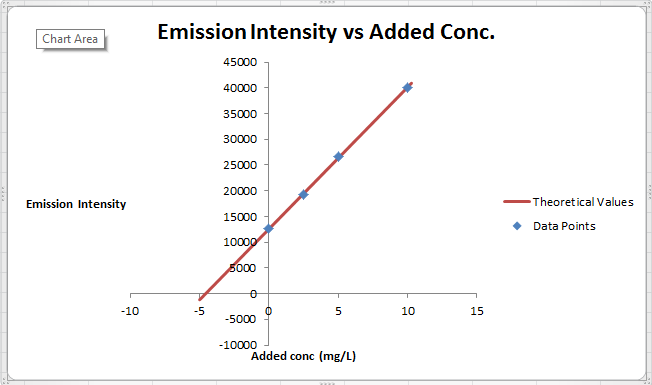
The summary of calculation is as follows.
| Added Au | Emission Intensity (y) | ||
| 0 | 12568 | ||
| 2.5 | 19324 | ||
| 5 | 26622 | ||
| 10 | 40021 | ||
| m | c | 2752.72 | 12590.6 |
| sm | sb | 30.7796445 | 176.3126 |
| r2 | sy | 0.99975001 | 227.6185 |
Here, the sigma values focus on the errors present in the parameter.
So far, we have filled
Now, we must determine the concentration of gold and its uncertainty. The concentration of gold is x. intercept of the graph, because that is the point at which the gold is absence so the difference between that and the zero added point must be the gold concentration in sample.
Now, x is a function of c and m. Thus, the uncertainty in them will be propagated to x as well. We have the following since m and c are independent.
x = x(m,c)
By propagation of uncertainty,
This is however, the standard error. Assuming the distribution of value to be normal about the value of x, this value would give an interval of 63.5% probability. However, if we want a 95% probability interval, we will have to multiply the error in x by 1.96.
Considering a confidence interval of 95% we have concentration of
Want to see more full solutions like this?
Chapter 10 Solutions
Principles of Instrumental Analysis
- Briefly indicate, with examples, the use of inorganic heterocycles in the synthesis of the corresponding polymers.arrow_forward1) Show how to use solid phase techniques to synthesize Ala-Val-Phe. You may use any amino acids (including protected amino acids) and any inorganic reagents that you wish in carrying out your synthesis. You don't need to show any mechanisms for this synthesis. You can maximize your chances of partial credit by showing key intermediates. (12 points)arrow_forward5) AZT is a drug that is used to treat HIV/AIDS. When cells take up AZT, they convert it to AZT- triphosphate. AZT-triphosphate prevents the virus from synthesizing new DNA from its RNA code. a. Write a 1-2 sentence explanation describing how AZT-triphosphate prevents DNA synthesis. (4 points) HO NH 'N' O © © N=N=N AZT b. Circle the location on AZT where the triphosphate group is appended (2 points)arrow_forward
- 1) What is epimerization? A) It involves changing the configuration of a carbon B) It involves oxidation of an aldose. C) It involves lengthening the chain of an aldose. D) It involves reduction of an aldose. E) none of the above 2) Which of the following monomer: polymer pairings is mismatched? a. Amino acids: proteins b. Amino acids: peptides c. Monosaccharides: polysaccharides d. Nucleotides: DNA e. They are all correctly matched 3) How do the a and ẞ anomer of a sugar differ? a. By the configuration of the acetal carbon in the ring form b. c. By whether a ketone or aldehyde is present in the straight chained form By the presence/absence of a 2' OH d. By whether the OH on the last chiral center is pointed right or left in the Fischer projection of the straight chained form 4) A salt bridge can occur as part of the apply) a. Primary structure b. Secondary structure of a protein (select all that c. Tertiary structure d. Quaternary structuré 5) True or false: A protein that has been…arrow_forward11C.7 Before solving the problem please also give a brief explanation of the concept or associated equation(s) and variables.arrow_forwardDraw the mechanism in the paperarrow_forward
- 7E.3 Before solving the problem please also give a brief explanation of the concept or associated equation(s) and variables.arrow_forward11c.5 Before solving the problem please also give a brief explanation of the concept or associated equation(s) and variables.arrow_forward(12 pts. - 3 pts. each part) For each of the following complexes, give the charge of the metal center and determine if the complex obeys the 18 Electron Rule. Show work or justification (a) Ni(PPh3)4 (b) (n-C6H6)Cr(CO)3 (c) (C2H4)2(n³-C3H5)W(CH3)2 (d) (cod)Rh(μ2-Cl)2Rh(cod) (No Rh-Rh bonds)arrow_forward
 Chemistry: Principles and PracticeChemistryISBN:9780534420123Author:Daniel L. Reger, Scott R. Goode, David W. Ball, Edward MercerPublisher:Cengage Learning
 Chemistry & Chemical ReactivityChemistryISBN:9781337399074Author:John C. Kotz, Paul M. Treichel, John Townsend, David TreichelPublisher:Cengage Learning
 Chemistry & Chemical ReactivityChemistryISBN:9781133949640Author:John C. Kotz, Paul M. Treichel, John Townsend, David TreichelPublisher:Cengage Learning


