
The graph thatrepresents the FRED data on gross federal debt held by the public as a percent of
Explanation of Solution
The dept to GDP ratio is the comparison of public debt of a country to its gross domestic product. This ratio indicates the ability to pay back debts of a particular country.
The following table represents the FRED data on gross federal debt held by the public as a percent of GDP for the United States:
| Date | Gross federal debt as % of GDP |
| 1945-01-01 | 103.15473 |
| 1946-01-01 | 106.31331 |
| 1947-01-01 | 89.85802 |
| 1948-01-01 | 78.80700 |
| 1949-01-01 | 78.64942 |
| 1950-01-01 | 73.04212 |
| 1951-01-01 | 61.77323 |
| 1952-01-01 | 58.47428 |
| 1953-01-01 | 56.11251 |
| 1954-01-01 | 57.48318 |
| 1955-01-01 | 53.25775 |
| 1956-01-01 | 49.44887 |
| 1957-01-01 | 46.26202 |
| 1958-01-01 | 47.02543 |
| 1959-01-01 | 44.99151 |
| 1960-01-01 | 43.65927 |
| 1961-01-01 | 42.40408 |
| 1962-01-01 | 41.06497 |
| 1963-01-01 | 39.84620 |
| 1964-01-01 | 37.51863 |
| 1965-01-01 | 35.13456 |
| 1966-01-01 | 32.41892 |
| 1967-01-01 | 31.00151 |
| 1968-01-01 | 30.77656 |
| 1969-01-01 | 27.32861 |
| 1970-01-01 | 26.38584 |
| 1971-01-01 | 26.01193 |
| 1972-01-01 | 25.20503 |
| 1973-01-01 | 23.91650 |
| 1974-01-01 | 22.24246 |
| 1975-01-01 | 23.42567 |
| 1976-01-01 | 25.48292 |
| 1977-01-01 | 26.37588 |
| 1978-01-01 | 25.81648 |
| 1979-01-01 | 24.37071 |
| 1980-01-01 | 24.91507 |
| 1981-01-01 | 24.61458 |
| 1982-01-01 | 27.65127 |
| 1983-01-01 | 31.29577 |
| 1984-01-01 | 32.37061 |
| 1985-01-01 | 34.73859 |
| 1986-01-01 | 38.00743 |
| 1987-01-01 | 38.92310 |
| 1988-01-01 | 39.17930 |
| 1989-01-01 | 38.83132 |
| 1990-01-01 | 40.44175 |
| 1991-01-01 | 43.66586 |
| 1992-01-01 | 46.00536 |
| 1993-01-01 | 47.36272 |
| 1994-01-01 | 47.11114 |
| 1995-01-01 | 47.17956 |
| 1996-01-01 | 46.25348 |
| 1997-01-01 | 43.97875 |
| 1998-01-01 | 41.05898 |
| 1999-01-01 | 37.71703 |
| 2000-01-01 | 33.25873 |
| 2001-01-01 | 31.37078 |
| 2002-01-01 | 32.37257 |
| 2003-01-01 | 34.15357 |
| 2004-01-01 | 35.16944 |
| 2005-01-01 | 35.22534 |
| 2006-01-01 | 34.95575 |
| 2007-01-01 | 34.84050 |
| 2008-01-01 | 39.44241 |
| 2009-01-01 | 52.21632 |
| 2010-01-01 | 60.15788 |
| 2011-01-01 | 65.16421 |
| 2012-01-01 | 69.64929 |
| 2013-01-01 | 71.38997 |
| 2014-01-01 | 72.91443 |
| 2015-01-01 | 71.97179 |
| 2016-01-01 | 75.70168 |
| 2017-01-01 | 75.13234 |
| 2018-01-01 | 76.52784 |
The following graph represents the FRED data on gross federal debt held by the public as a percent of GDP for the United States:
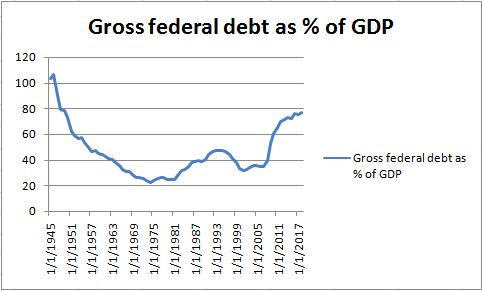
The post-1945 period is considered to be the post-war era. Just after the Second World War in 1946 (the debt ratio was a high of 10,31331), the United States experienced sustained declines in the federal debt-to-GDP ratio. The decrease in the federal debt-to-GDP ratio lasts until 1974 (22.24246 debt-to-GDP ratio).
The most critical period of debt growth is the 1980 to 1995. The next biggest increase was from 1974 to 1979. The debt has exploded surprisingly since 2008 (the Great Recession), the period from 2008 to the end of 2013 continues to rise in the federal debt-to-GDP ratio of United States.
The causes of sharp debt-to-GDP ratio expansion are the rising income inequality of the country and its persistent deficit.
President N's decision to dissociate the dollar from the gold standard in 1971 was the first reason behind persistent deficit because dollars were no longer exchanged for gold and the government was free to spend as long as it could, worsening the deficits.
High income disparities and large deficits result in spending inequalities, so rise in the amount of U.S. debt persists as a weapon that can keep the economy from slowing down and increase
Want to see more full solutions like this?

- Considering the recent expenditure of governments across the world in providing vaccines free of cost to their respective citizens, we assume that government is facing a temporary budget deficit. Based on these circumstances and the additional difficulties due to the ongoing pandemic, please answer each of the following questions related to the country you have or will be speaking about during your presentation. Please write the equation for GDP to reflect a possible budget deficit. Now, based on the above situation, explain in your own words, how will the government for the country of your choice expect to address the situation or has already planned to reduce the budget deficit. Assume you are an investor in your country, how will the choice for investment change due to the expectation of government policy in your response for part (a) above? Explain with the help of a diagram as you feel appropriate. Assume the labor demand has been affected due to the pandemic and as per your…arrow_forwardSavings and wealth - Although the United States is one of the richest nations in the world, it is also one of the world's largest debtor nation. We often hear that the problem is our low savings rate. Suppose policy makers attempt to rectify this be encouraging greater savings in the economy. What could they do to make you save more? Would raising minimum wage help? What effects would their successful attempts have on GDP? Is this a good or bad idea? What can you do to increase your savings rate? Also, how is wealth related to savings?arrow_forwardWhat role taxes policy plays in determining the GDP or national income in an economy? Explain with numerical examples?arrow_forward
- Need asap please... If the U.S. government wanted to, it could just say that everyone who is unemployed is “employed in the job search” and receiving a paycheck for this “work,” and the government could claim that these government employees are producing “job search services.” Recall that in the official definition of GDP, government purchases(G), do not include transfer payments like unemployment checks and Social Security. -- Would this change in the definition of GDP increase GDP? Would it improve well-being?arrow_forwardIn an economy where people spend 80% of their incomes, the government lowers taxes by $5000. Calculate the change in real GDP that results. (Be extra careful to follow numeric instructions; round intermediate steps to four decimal places and your final answer to two. Use a positive number to denote an increase and a negative number (with negative sign) to denote a decrease.)arrow_forwardIf total GDP for this economy is $17.04 trillion for the year shown in the table below, what was the total amount of government spending? Round your answer to the nearest hundredth. Components of GDP on the Demand Side (in trillions of dollars) trillion Consumption Investment Government spending Exports Imports Provide your answer below: Total GDP 11.61 3.11 ? 2.71 2.84 17.04arrow_forward
- How do budget surpluses and budget deficits affect the consumption and investment components of GDParrow_forwardDiscuss how policymakers use national income data to make decisions about taxes, spending, and other economic policies.arrow_forwardthe new equilibrium level of real GDP if government spending increases by $150? 18. What is the new equilibrium level of real GDP if government spending and taxes both increase by $150? 19. Make a graph showing the spending and tax revenue of your state government for as many years as you can find (use the government of your home country if you are not from the United States). What trends do you notice? What spending categories make up the largest share of the state budget? What are the largest sources of revenue?arrow_forward
- Give typing answer with explanation and conclusion Explain why a $1 increase in government spending leads to more than a $1 increase in GDP.arrow_forwardTAXES Taxes are any governmental action that reduces the real income of wage-earners as well as non-working Americans. The action can also reduce the profit of business. Taxes act as a leakage from the GDP – Income Stream and will reduce both income and GDP over time. Think of taxes…. Did you buy gas on the way to school? Did it include a tax? When you purchase clothing at the mall, how much is the tax? Driver’s License? Fishing License? Hunting License? Tax on Concert Ticket? Tax on Airline Ticket? Are taxes withheld from your paycheck? Income, FICA and state or local taxes Paying bridge tolls? Taxes on personal or real property? Tax on new tires? Alcohol? Cigarettes? Imports with tariffs? Do all these taxes and licenses reduce our disposable income? Why do we sacrifice and pay these taxes? What are the ways that government helps us?arrow_forwardAssume the following to answer the following question: C= 1000+ .9 (Y-T) Tax rate = 0.1Y Imports = 0.1(Y-T) Government spending = 200 Investment = 300 Exports = 600 Potential Output = $8000 What is the current GDP in this economy?arrow_forward


 Economics (MindTap Course List)EconomicsISBN:9781337617383Author:Roger A. ArnoldPublisher:Cengage Learning

 Macroeconomics: Private and Public Choice (MindTa...EconomicsISBN:9781305506756Author:James D. Gwartney, Richard L. Stroup, Russell S. Sobel, David A. MacphersonPublisher:Cengage Learning