Sub part (a):
The possible combination of consumption of two goods.
Sub part (a):
Explanation of Solution
The consumption bundle of two goods can be calculated by using the following formula.
Substitute the respective values in equation (1) to calculate the number of peanut bags purchased while consuming 0 units of candy bars.
When the person consumes 0 quantities of candy bars, then he can purchase 10 units of peanut bags.
Table -1 shows the possible quantity of candy bars and peanut bags with the given level of income that is obtained by using equation (1).
Table -1
| Goods/Combination | 1 | 2 | 3 | 4 | 5 | 6 |
| Candy bars | 0 | 4 | 8 | 12 | 16 | 20 |
| Bags of peanuts | 10 | 8 | 6 | 4 | 2 | 0 |
Concept introduction:
Budget constraint: Budget constraints define the possible bundles of services and commodities that are purchased at a given price level with the entire income.
Sub part b:
The possible combination of consumption of two goods.
Sub part b:
Explanation of Solution
The diagram below shows the possible combination of two goods that can be purchased with the limited income. It is drawn based on the values given in the Table -1.
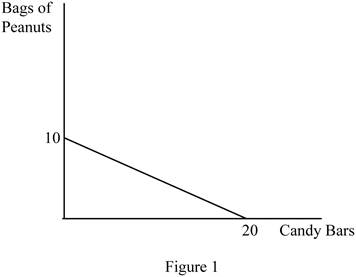
In Figure 1, the horizontal axis measures the quantity of candy bars and the vertical axis measures the quantity of peanut bags. The downward slope indicates the budget line.
The slope can be calculated as follows.
Thus, the slope of this budget line is -0.5.
Opportunity cost (OP) of obtaining one more candy bar can be calculated as follows.
In the calculation of opportunity cost, the sign can be ignored. Thus, the opportunity cost of getting one more candy bar is 0.5.
The opportunity cost (OP) of obtaining one more peanut bag can be calculated as follows.
In the calculation of opportunity cost, the sign can be ignored. The opportunity cost of getting one more candy bar is 2. The opportunity costs are constant over the possible combination of bundles since the slope of the budget line remains the same over different points in the budget line.
Concept introduction:
Budget constraint: Budget constraints define the possible bundles of services and commodities that are purchased at a given price level with the entire income.
Opportunity cost: Opportunity cost refers to the benefits given up in the process of obtaining some other benefit.
Sub part (c):
The possible combination of consumption of two goods.
Sub part (c):
Explanation of Solution
The budget line shows only the possible combination of goods and services that can be purchased simultaneously within the given income level. Thus, it does not determine the optimum quantity of two goods.
Concept introduction:
Budget constraint: Budget constraints define the possible bundles of services and commodities that are purchased at a given price level with the entire income.
Opportunity cost: Opportunity cost refers to the benefits given up in the process of obtaining some other benefit.
Sub part (d):
The possible combination of consumption of two goods.
Sub part (d):
Explanation of Solution
Table -2 shows the possible quantity of candy bars and peanut bags with the increased level of income that is obtained by using equation (1).
Table -2
| Goods/ Combination | 1 | 2 |
| Candy bars | 0 | 40 |
| Bags of peanuts | 20 | 0 |
The diagram below shows the possible combination of two goods that can be purchased with a limited income. It is drawn based on the values given in Table -2.
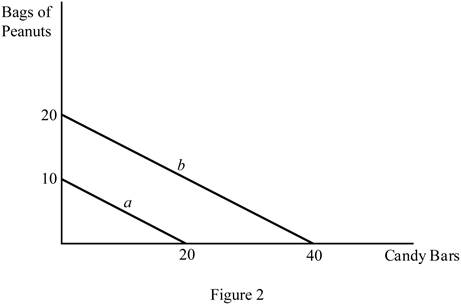
In Figure 2, the horizontal axis measures the quantity of the candy bar and the vertical axis measures the peanut bags. The downward slope (a) indicates the budget line with a $15 income, and the downward slope (b) indicates the budget line with a $30 income. Increasing the level of the income shifts the budget line to the right side.
Concept introduction:
Budget constraint: Budget constraints define the possible bundles of services and commodities that are purchased at a given price level with the entire income.
Opportunity cost: Opportunity cost refers to the benefits given up in the process of obtaining some other benefit.
Want to see more full solutions like this?
Chapter 1 Solutions
Microeconomics: Principles, Problems, & Policies (McGraw-Hill Series in Economics)

- Caci, un he would spend a dollar buying a first cup of coffee? LO7.2 4. Columns 1 through 4 in the following table show the marginal utility, measured in utils, that Ricardo would get by purchasing various amounts of products A, B, C, and D. Column 5 shows the marginal utility Ricardo gets from saving. Assume that the prices of A, B, C, and D are, respectively, $18, $6, $4, and $24 and that Ricardo has an income of $106. LO7.2 a. What quantities of A, B, C, and D will Ricardo purchase in maximizing his utility? b. How many dollars will Ricardo choose to save? c. Check your answers by substituting them into the algebraic statement of the utility-maximizing rule. nuts, coffee, or both. How big would that buuget nave LU DC DCIUIUarrow_forwardIf the price of an apple is $.50, the marginal utility per dollar spent for the fifth apple is Number of Apples Total Utility 130 180 220 A C E 2 3 4 LO 5 Noi 6 7 40 20 60 250 270 280 morfw escleris con B D 100 30 Larrow_forwardSuppose Duncan budgets $20 a week for entertainment. He can either go bowling for $4 a game, or play mini golf for $6 a game. Duncan maximizes his total utility by bowling twice and playing two games of mini golf. If the marginal utility from his second game of mini golf equals 12, what is the marginal utility per dollar from his second game of bowling? O 2 4-arrow_forward
- 0 2 O 4 6 08 D Scones 10 1 2 3 4 5 Total Utility 10 18 24 Refer to Table 6.3, which shows the total utility and marginal utility derived from the consumption of scones. The first column of the table represents the number of scones a consumer consumes in a day. The second column of the table presents the total utility derived from that consumption, and the third column shows the marginal utility of each additional scone. The total utility derived from the consumption of one scone is units. 28 30 Marginal Utility 6 2arrow_forwardTitle Suppose that Lynn enjoys coconut oil in her coffee. She has very particular preferences, and she mus Description Suppose that Lynn enjoys coconut oil in her coffee. She has very particular preferences, and she must have exactly two spoonfuls of coconut oil for each cup of coffee. Let C be the number of cups of coffee, and O be the number of spoonfuls of coconut oil. Also, let PC be the price of a cup of coffee. Suppose Lynn has $12 to spend on coffee and coconut oil. Also, the price of coconut oil is $.50 per spoonful.a) Graph Lynnâs Price Consumption Curve for prices, PC = $1, PC = $2, and PC = $3. Please put the number of cups of coffee on the horizontal axis, and the number of spoonfuls of coconut oil on the vertical axis. Be sure to label your graph carefully and accurately.b) Graph Lynnâs demand curve for coffee. You may assume that both coconut oil and coffee are continuous variables so she can consume any amount of coffee and coconut oil that she could afford.…arrow_forwardSuppose that the following Cobb-Douglas utility function is given U(X,Y) = X³y/2, Which of the following is correct? O Law of diminishing Marginal Utility holds for good Y but not for good X while Law of Diminishing Marginal Rate of Substitution holds. Law of diminishing Marginal Utility holds for good X but not for good Y while Law of Diminishing Marginal Rate of Substitution holds. Law of diminishing Marginal Utility holds for good Y but not for good X while Law of Diminishing Marginal Rate of Substitution fails to hold. Law of diminishing Marginal Utility holds for both goods and Law of Diminishing Marginal Rate of Substitution holds as wellarrow_forward
- John likes Coca-Cola. After consuming one Coke, John has a total utility of 10 utils. After two Cokes, he has a total utility of 25 utils. After three Cokes, he has a total utility of 50 utils. Does John show diminishing marginal utility for Coke, or does he show increasing marginal utility for Coke? Supposethat John has $3 in his pocket. If Cokes cost $1 each and John is willing to spend one of his dollars on purchasing a first can of Coke, would he spend his second dollar on a Coke, too? What about the third dollar? If John’s marginal utility for Coke keeps on increasing no matter how many Cokes he drinks, would it be fair to say that he is addicted to Coke?arrow_forwardJohn likes Coca-Cola. After consuming one Coke, John has a total utility of 10 utils. After two Cokes, he has a total utility of 25 utils. After three Cokes, he has a total utility of 50 utils. Does John show diminishing marginal utility for Coke or does he show increasing marginal utility for Coke? Suppose that John has $3 in his pocket. If Cokes cost $1 each and John is willing to spend one of his dollars on purchasing a first can of Coke, would he spend his second dollar on a Coke, too? What about the third dollar? If John’s marginal utility for Coke keeps on increasing no matter how many Cokes he drinks, would it be fair to say that he is addicted to Coke? *use tables and/or graphs if possible, please original workarrow_forwardO O O A. 33 B. 56 C. 29 O D. 35 Units 1 2 E. 59 345W N 6 7 Marginal Utility 10 0053 O 8 Toffee (bars) 1 Total Utility 10 18 23 26 27 27 27 Refer to the table above. If this consumer purchases 3 toffee bars and 5 bags of cashews per week, his/her total utility will be Cashews (bags) Marginal Utility 12 10 7 5 2 1 0 Total Utility 12 22 29 34 36 37 27arrow_forward
- Table 6.1 Pretzels Marginal Utility 1 30 20 3 5 4 Refer to Table 6.1, which shows the marginal utility of each additional unit of pretzel for a consumer. The first column of the table shows the number of pretzels consumed in a day, and the second column of the table shows the marginal utility of each additional unit of pretzel. The total utility derived from the consumption of three pretzels is units. O a. 5 O b. 55 Oc. 15 Od. 57 O e. 70arrow_forward(Table) In the table, assume that a consumer has a budget of $75. Movies cost $15 per movie (with popcorn), and dinner costs $15 per dinner. Utility will be maximized by buying Hint: You will need to create a few extra columns to solve Price Movie = $15.00 Price Dinner = $15.00 Movies per Total Utility month Eating out Total Utility per month 5 135 50 4 125 2 90 110 125 2 90 4 155 1 55 175 O A. 2 movies /3 dinners O B. 1 movie / 4 dinners O C.4 movies / 1 dinners. O D.3 movies /2 dinners O E. there is no combination of goods that maximize utility Moving to another question will save this response. Question 1 of 75 Priv Terr MacBook Pro 吕0 DII DD esc F4 F5 F6 F7 F8 F9 F10 F11 F12 F1 F2 F3 %23 24 & 1 2 4 5 7 8. { Q W E R Y tab D F G つ K caps lock P # 3arrow_forwardTABLE 6-1 Quantity (burgers) Total Utility Marginal Utility 0. 1 20 20 44 24 X 22 4. 84 y Refer to Table 6-1. The table shows Antonio's total and marginal utility from eating burgers. What is the marginal utility that Antonio gets from eating the 4th burger (y)? O 22 18 16 20arrow_forward

 Principles of Economics (12th Edition)EconomicsISBN:9780134078779Author:Karl E. Case, Ray C. Fair, Sharon E. OsterPublisher:PEARSON
 Engineering Economy (17th Edition)EconomicsISBN:9780134870069Author:William G. Sullivan, Elin M. Wicks, C. Patrick KoellingPublisher:PEARSON
 Principles of Economics (MindTap Course List)EconomicsISBN:9781305585126Author:N. Gregory MankiwPublisher:Cengage Learning
 Managerial Economics: A Problem Solving ApproachEconomicsISBN:9781337106665Author:Luke M. Froeb, Brian T. McCann, Michael R. Ward, Mike ShorPublisher:Cengage Learning
 Managerial Economics & Business Strategy (Mcgraw-...EconomicsISBN:9781259290619Author:Michael Baye, Jeff PrincePublisher:McGraw-Hill Education