
Concept explainers
Videos
To graph: The

Answer to Problem 30SGR
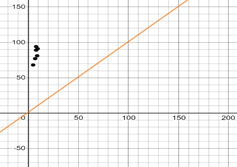
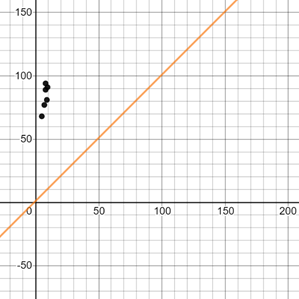
The scatter plot of the above mention data is shown below where x axis represents number of sleep hours and y axis represents total score.
Explanation of Solution
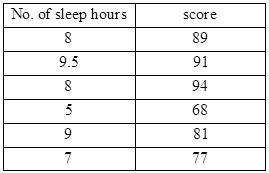
Given information:
The data for scatter plot is mentioned above in the problem.
Graph:
The scatter plot is mentioned below where x axis represents number of sleep hours and y axis represents total score.
Interpretation:
Consider the statement to graph the scatter plot.
As the data is mentioned.
We take x axis as number of sleep hours and y axis as total score.
Then plot these points on the graph as we observe above.
Therefore the scatter plot we gained is mentioned above.
Chapter 1 Solutions
Pre-Algebra Student Edition
Additional Math Textbook Solutions
Linear Algebra and Its Applications (5th Edition)
College Algebra (7th Edition)
College Algebra
Elementary Algebra


 Algebra and Trigonometry (6th Edition)AlgebraISBN:9780134463216Author:Robert F. BlitzerPublisher:PEARSON
 Contemporary Abstract AlgebraAlgebraISBN:9781305657960Author:Joseph GallianPublisher:Cengage Learning
 Linear Algebra: A Modern IntroductionAlgebraISBN:9781285463247Author:David PoolePublisher:Cengage Learning
 Algebra And Trigonometry (11th Edition)AlgebraISBN:9780135163078Author:Michael SullivanPublisher:PEARSON
 Introduction to Linear Algebra, Fifth EditionAlgebraISBN:9780980232776Author:Gilbert StrangPublisher:Wellesley-Cambridge Press
 College Algebra (Collegiate Math)AlgebraISBN:9780077836344Author:Julie Miller, Donna GerkenPublisher:McGraw-Hill Education