a.
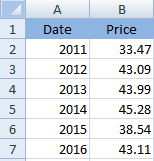
To show: The data in tabular form in new worksheet.
Introduction: An investor may purchase stock of a company and become the stockholder (owner) of the company. Based on the performance of the company and demand for company’s stocks, the value of company’s stocks increases or decreases.
a.
Explanation of Solution
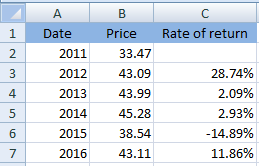
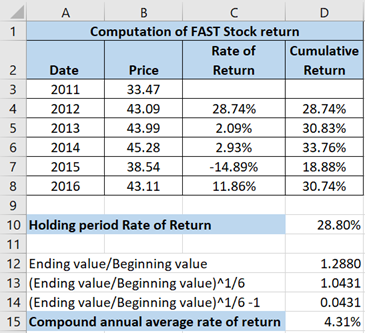
The date have been shown in ‘column A’ while price of stock has been represented in ‘column’ B. The tabular presentation of the given data has been shown below:
b.
To compute:
Introduction: An investor may purchase stock of a company and become the stockholder (owner) of the company. Based on the performance of the company and demand for company’s stocks, the value of company’s stocks increases or decreases.
b.
Explanation of Solution
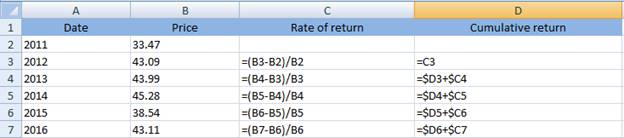
Rate of return for each year has been computed using the following formula:
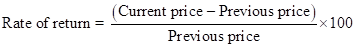
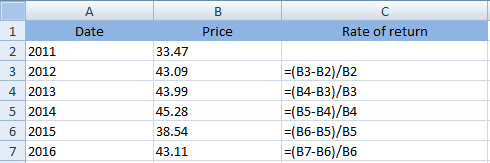
Thus, the calculated rate of return has been shown below:
c.
To compute: Cumulative total return since 2011.
Introduction: An investor may purchase stock of a company and become the stockholder (owner) of the company. Based on the performance of the company and demand for company’s stocks, the value of company’s stocks increases or decreases.
c.
Explanation of Solution
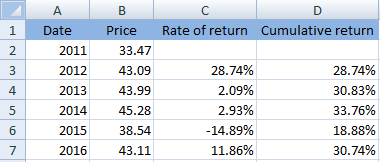
Cumulative rate of return can be computed by adding each year’s rate of return. It can be computed on excel using following formula:
Thus, the calculated cumulative rate of return has been shown below:
d.
To compute: Rate of return for holding period and compound average rate of return.
Introduction: An investor may purchase stock of a company and become the stockholder (owner) of the company. Based on the performance of the company and demand for company’s stocks, the value of company’s stocks increases or decreases.
d.
Explanation of Solution
The rate of return for the holding period can be computed as:

The calculated answer has been shown below:
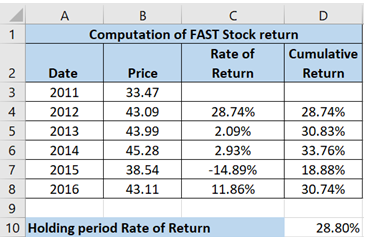
Now, compound annual average of return can be computed using:

e.
To prepare: Line chart and scattered chart. Also, state the difference between the two charts and suggest the most suitable.
Introduction: An investor may purchase stock of a company and become the stockholder (owner) of the company. Based on the performance of the company and demand for company’s stocks, the value of company’s stocks increases or decreases.
e.
Explanation of Solution
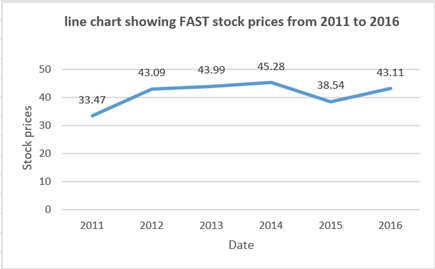
The line chart has been prepared for FAST stock prices:
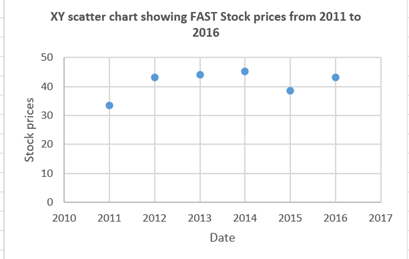
The scattered chart has been prepared for FAST stock prices:
Following are the differences between line and scatter chart:
Line chart: The values ??are plotted only on the y-axis i.e., the vertical axis. While, on the x-axis i.e., the horizontal axis the sequence number of the value is shown. Exceptions: graphs with the date on the X-axis.
Scatter chart: The relationship between two values is represented using the scatter chart. Scatter charts is often known as XY chart.
Here, two different values are not given which means there is no need to find the relationship between two values. So, in order to find trend of stock prices a line chart is more appropriate.
f.
To prepare: 3-D line chart and discuss if it helps in better understanding.
Introduction: An investor may purchase stock of a company and become the stockholder (owner) of the company. Based on the performance of the company and demand for company’s stocks, the value of company’s stocks increases or decreases.
f.
Explanation of Solution
The line chart has been prepared for FAST stock prices:

The 3-D line chart has been prepared:
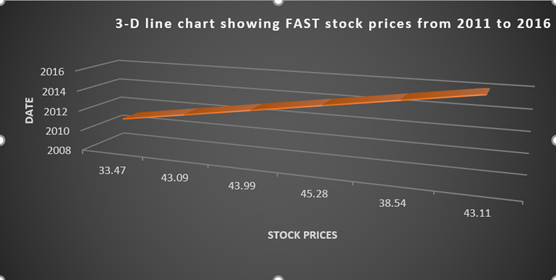
The comparison between the two charts can be seen easily. Thus, yes the enhancements will make data more attractive for the reader.
Want to see more full solutions like this?
Chapter 1 Solutions
EBK FINANCIAL ANALYSIS WITH MICROSOFT E

- You want to check if GRBH stock is fairly priced in the markets by using the fundamental analysis. For this purpose, you have gathered the following information: GRBH pays dividends once a year and the next dividend payment is expected to be made in one year. You project the EPS of the first and second year to be $5 and $7 respectively. The company dividend payout ratio is stable at 0.2. At the end of the second year, you assume that the company would become the average company in the industry. The industry average PE ratio is 8. You believe that the appropriate required rate of return on GRBH stock is 10% (CCR per annum). And the current market price of GRBH stock is $45 Find the alpha ( Expected abnormal rate of return, c ) assuming the mispriced figure would be corrected in a year.arrow_forwardExplain how a financial market operates? Which of the investment constraints is expected to have the most impact on your decision process? You plan to buy common stock and hold it for one year. You expect to receive both ₱150 and ₱260 from the sale of the stock at the end of the year. How much will you pay for the stock, if you want to a. Have a return of 8% b. A return of 20% c. A return of 15%arrow_forwardGo to finance.yahoo.com, search for the stock page for Merck (MRK). Find MRK's current trading price, Forward Dividend (Annual) in dollar, and its 1-year target estimate. Calculate the stock price if you required rate of return is 10% per year. This would be your intrinsic value (The fair price for Merck if the required rate of return is 10%). - Compare it to the current stock price from the website, would you buy the stock? - If you buy the stock today at the price you find on Yahoo, what would be your rate of return over the next year?arrow_forward
- Log on to finance.yahoo.com and enter the ticker symbol "LVS" in the Quote Lookup box to find information about Las Vegas Sands Corp. Download monthly adjusted closing stock price data (Adj Close) for five years. The first month should be March 01, 2019 and the 60th month should be February 01, 2024. Please make sure that your dataset has a total of 60 months. Assuming that returns follow a normal distribution, answer the following question: (1) What is LVS's annualized expected return? (2) What is LVS's annualized standard deviation? (3) What is the minimum return for LVS with a 99.73% probability? (4) What is the maximum return for LVS with a 99.73% probability? N:B: Your final answer should be rounded to 2 decimal places and make sure the final answer has the proper unit of measurement wherever appropriate (e.g., if the number is a dollar number, put "$" sign at the beginning; if the number is a percentage, put "%" at the end. Make sure the dataset has 60 observations from March 01,…arrow_forward(Calculating rates of return) Blaxo Balloons manufactures and distributes birthday balloons. At the beginning of the year Blaxo's common stock was selling for $17.95 but by year end it was only $16.91. If the firm paid a total cash dividend of $1.76 during the year, what rate of return would you have earned if you had purchased the stock exactly one year ago? What would your rate of return have been if the firm had paid no cash dividend? The rate of return you would have earned is %. (Round to two decimal places.)arrow_forwardIn doing a five-year analysis of future dividends, the Dawson Corporation is considering the following two plans. The values represent dividends per share. Use Appendix B for an approximate answer but calculate your final answer using the formula and financial calculator methods. Year Plan A Plan B 1 $ 1.30 $ 0.30 2 1.30 1.60 3 1.30 0.20 4 1.50 4.00 5 1.50 1.80 a. How much in total dividends per share will be paid under each plan over five years? (Do not round intermediate calculations and round your answers to 2 decimal places.) b-1. Mr. Bright, the Vice-President of Finance, suggests that stockholders often prefer a stable dividend policy to a highly variable one. He will assume that stockholders apply a lower discount rate to dividends that are stable. The discount rate to be used for Plan A is 11 percent; the discount rate for Plan B is 14 percent. Compute the present value of future dividends.…arrow_forward
- The annual rate of return on any given stock can be found as the stock's dividend for the year plus the change in the stock's price during the year, divided by its beginning-of-year price. If you obtain such data on a large portfolio of stocks, like those in the S&P 500, find the rate of return on each stock, and then average those returns, this would give you an idea of stock market returns for the year in question. true/falsearrow_forwardproblems should be solved by using a financial calculator or MS excel spreadsheet. Accordingly, you must show the values of all relevant time valu of money variables ABC stock selss for $60.25 per shar. Its required rate of return is 10.25%. The dividend is expected to grow at a constant rate of 7.00% per year. What is the expected year-end dividend, D1?arrow_forwardSuppose you bought a stock for $50 on January 1st. Six months later you received a dividend of $1.10 and you sold the stock for $53.30. Given this information, annualized return is ______________. answer is 17.6%arrow_forward
- Calculating the geometric and arithmetic average rate of return) Marsh Inc. had the following end-of-year stock prices over the last five years and paid no cash dividends: Time Marsh 1 $11 2 11 3 18 4 9 5 11 (Click on the icon in order to copy its contents into a spreadsheet.) a. Calculate the annual rate of return for each year from the above information. b. What is the arithmetic average rate of return earned by investing in Marsh's stock over this period? c. What is the geometric average rate of return earned by investing in Marsh's stock over this period? d. Considering the beginning and ending stock prices for the five-year period are the same, which type of average rate of return (the arithmetic or geometric) better describes the average annual rate of return earned over the period? Question content area bottom Part 1 a. The annual rate of return at the end of year 2 is enter your…arrow_forwardAnswer the Situation correctly show your Solution.(Also show the formulas that used) As a new trader , you bought a common stock , 35 shares of Globe Telecom Inc ( GTI), at Php 265 per share. You heard from some investors that being a utility company , GTI is estimated to be growing in value by 2% every year . Hence , you expect to receive dividends which also grow at 2% each year. What is the value of you GTI stocks? If Php 10.10 was paid as dividend today, find the amount of dividend you are expecting to receive in the next five years . Year Dividend (Php) 1 2 3 4 5arrow_forwardYou are considering acquiring a common stock that you would like to hold for one year. You expect to receive both $1.50 in dividends and $26 from the sale of the stock at the end of the year. What is the maximum price you would pay for the stock today if you wanted to earn a 15% return? Give typing answer with explanation and conclusionarrow_forward
 Essentials Of InvestmentsFinanceISBN:9781260013924Author:Bodie, Zvi, Kane, Alex, MARCUS, Alan J.Publisher:Mcgraw-hill Education,

 Foundations Of FinanceFinanceISBN:9780134897264Author:KEOWN, Arthur J., Martin, John D., PETTY, J. WilliamPublisher:Pearson,
 Fundamentals of Financial Management (MindTap Cou...FinanceISBN:9781337395250Author:Eugene F. Brigham, Joel F. HoustonPublisher:Cengage Learning
 Corporate Finance (The Mcgraw-hill/Irwin Series i...FinanceISBN:9780077861759Author:Stephen A. Ross Franco Modigliani Professor of Financial Economics Professor, Randolph W Westerfield Robert R. Dockson Deans Chair in Bus. Admin., Jeffrey Jaffe, Bradford D Jordan ProfessorPublisher:McGraw-Hill Education