
Concept explainers
Videos
Salary after College. In 2010, Monster College surveyed 1250 U.S. college students expecting to graduate in the next several years. Respondents were asked the following question :
What do you think your starting salary will be at your first job after college?
The line graph shows the percentage of college students who anticipated various starting salaries. Use the graph to solve Exercises 9-14.
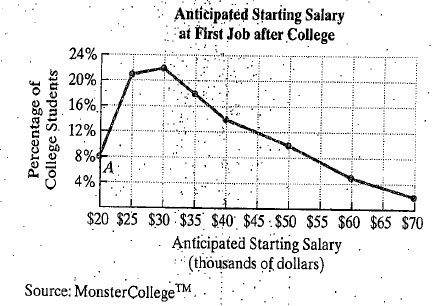
The mathematical model
describes the percentage of college students, p, who anticipated a starting salary s, in thousands of dollars. Use this formula to find the percentage of students who anticipated a starting salary of $40 thousand. How does this compare with your estimate in Exercise 13?
Want to see the full answer?
Check out a sample textbook solution
Chapter 1 Solutions
EBK PRECALCULUS


- Graph on the number line: (a) x2 (b) x3 (c) x1arrow_forwardCollege students are graduating with the highest debt burden in history. The bar graph shows the mean, or average, student-loan debt in the United States for five selected graduating years from 2001 through 2013. Here are two mathematical models for the data shown by the graph. In each formula, D represents mean student-loan debt, in dollars, x years after 2000. The Model 1 is, D = 1188x + 16,218 and the Model 2 is D = 46x2 + 541x + 17,650. Solve, a. Which model better describes the data for 2001?b. Does the polynomial model of degree 2 underestimate or overestimate the mean student-loan debt for 2013? By how much?arrow_forwardWhen Ms. Celano has excellent service at a restaurant, the amount she leaves for a tip t is at least 20% of the cost of the meal c. Write a model representing the amount of the tip.arrow_forward
- After eating at a restaurant, it is customary to leave a tip t for the server for at least 15% of the cost of the meal c. Write a model to represent the amount of the tip based on the cost of the meal.arrow_forwarda. According to the linear model, what was the average cost of room and board at public four-year colleges for the school year ending in 2013? The average cost was $___(Round to the nearest dollar as needed.) Im looking at the graph image and still do not understand this math problem. Please help. Both answers that I came up with for this solution, 5877 were incorrect and 7228 was also incorrect.arrow_forwardTotal fitness gym had 125 members in 2017 When the manager analyzed the growth in membership she found an annual increase of 5% what type of fuctionn best models the total membership in this situation. A. Quadratic fuction. B. Theres not enough information C. Exponential fuction D. Linear fuction.arrow_forward
- Please answer question d)arrow_forwardSolve Q3arrow_forwardThe bar graph gives the average atmospheric concentration of carbon dioxide. a. Estimate the yearly increase in the average atmospheric concentration of carbon dioxide. Express the answer in parts per million. b. Write a mathematical model that estimates the average atmospheric concentration of carbon dioxide, C, in parts per million, x years after 1950. c. If the trend shown by the data continues, use your mathematical model from part (b) to project the average atmospheric concentration of carbon dioxide in 2030. Average Atmospheric Concentration of Carbon Dioxide 500- 314 320 329 341 354 368 389 397 300- 400- 200- 100- 19501960 197019801990200020102015 a. The yearly increase in the average atmospheric concentration of carbon dioxide is approximately ppm per year. (Round to the nearest tenth as needed.) b. A mathematical model that estimates the average atmospheric concentration of carbon dioxide, C, in parts per million, x years after 1950 is C = (Use integers or decimals for any…arrow_forward
- The geometric average of -12%, 20%, and 25% is 9.7% 11% 18.88% 8.42%arrow_forwardDaniel rides his bike around the local park twice a week. He starts keeping time when he leaves his house. After circling the park every three times, he notes how long he has been riding. The table shows the times for several laps. Use a graph and an equation to find the time it will take Daniel to bike 21 laps. Daniel's Lap Times Time (min) Laps 3 16 6. 26 36 12 46 15 56 a. 21.4 min b. 76 min с. 70 min 86 min d.arrow_forward"Save today by switching to SOAR!" is the slogan for SOAR, a cell phone service provider. Logan wants to estimate how much money customers who switch to SOAR save on their monthly bill. He surveys 75 people who have recently switched to SOAR and asks each one how much they are saving in their monthly bill as a result of the switch. He finds the average savings of the sample to be $19.03 and historical records indicate that o = $4.71 What is the standard error in estimating monthly phone bill savings? 0.895 0.544 4.710 0.236arrow_forward
 Holt Mcdougal Larson Pre-algebra: Student Edition...AlgebraISBN:9780547587776Author:HOLT MCDOUGALPublisher:HOLT MCDOUGAL
 Trigonometry (MindTap Course List)TrigonometryISBN:9781337278461Author:Ron LarsonPublisher:Cengage Learning
 Glencoe Algebra 1, Student Edition, 9780079039897...AlgebraISBN:9780079039897Author:CarterPublisher:McGraw Hill
 Big Ideas Math A Bridge To Success Algebra 1: Stu...AlgebraISBN:9781680331141Author:HOUGHTON MIFFLIN HARCOURTPublisher:Houghton Mifflin Harcourt
 Elementary AlgebraAlgebraISBN:9780998625713Author:Lynn Marecek, MaryAnne Anthony-SmithPublisher:OpenStax - Rice University