
Concept explainers
Videos
a.
To find:The leaf and stem plot for the data
a.
Answer to Problem 1.44SE
The leaf and stem plot for the data is shown in Figure-1.
Explanation of Solution
Given information: The data is shown below.
| Name | Length (mi) | Name | Length (mi) | |
| Superior | 350 | Titicaca | 122 | |
| Victoria | 250 | Nicaragua | 102 | |
| Huron | 206 | Athabasca | 208 | |
| Michigan | 307 | Reindeer | 143 | |
| Aral Sea | 260 | Tonie Sap | 70 | |
| Tanganyika | 420 | Turkana | 154 | |
| Baykal | 395 | lssykKul | 115 | |
| Great Bear | 192 | Torrens | 130 | |
| Nyasa | 360 | Vanern | 91 | |
| Great Slave | 298 | Nettilling | 67 | |
| Erie | 241 | Winnipegosis | 141 | |
| Winnipeg | 266 | Albert | 100 | |
| Ontario | 193 | Nipigon | 72 | |
| Balkhash | 376 | Gairdner | 90 | |
| Ladoga | 124 | Urmia | 90 | |
| Maracaibo | 133 | Manitoba | 140 | |
| Onega | 145 | Chad | 175 | |
| Eyre | 90 | |||
Calculation:
The leaf and stem plot is shown below.
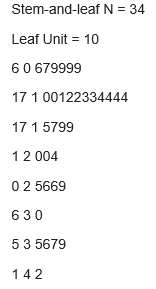
Figure-1
Thus, the leaf and stem plot for the data is shown in Figure-1.
b.
To find: The histogram for the data.
b.
Answer to Problem 1.44SE
The histogram for the data is shown in Figure-2.
Explanation of Solution
Given information: The data is shown below.
| Name | Length (mi) | Name | Length (mi) | |
| Superior | 350 | Titicaca | 122 | |
| Victoria | 250 | Nicaragua | 102 | |
| Huron | 206 | Athabasca | 208 | |
| Michigan | 307 | Reindeer | 143 | |
| Aral Sea | 260 | Tonie Sap | 70 | |
| Tanganyika | 420 | Turkana | 154 | |
| Baykal | 395 | lssykKul | 115 | |
| Great Bear | 192 | Torrens | 130 | |
| Nyasa | 360 | Vanern | 91 | |
| Great Slave | 298 | Nettilling | 67 | |
| Erie | 241 | Winnipegosis | 141 | |
| Winnipeg | 266 | Albert | 100 | |
| Ontario | 193 | Nipigon | 72 | |
| Balkhash | 376 | Gairdner | 90 | |
| Ladoga | 124 | Urmia | 90 | |
| Maracaibo | 133 | Manitoba | 140 | |
| Onega | 145 | Chad | 175 | |
| Eyre | 90 | |||
Calculation:
The histogram is shown below.
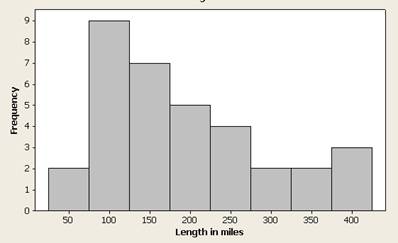
Figure-2
Both the graph provides the same information.
Thus, the histogram for the data is shown in Figure-2.
c.
To find:Whether the data is skewed or symmetric.
c.
Answer to Problem 1.44SE
The data is skewed.
Explanation of Solution
Given information: The data is shown below.
| Name | Length (mi) | Name | Length (mi) | |
| Superior | 350 | Titicaca | 122 | |
| Victoria | 250 | Nicaragua | 102 | |
| Huron | 206 | Athabasca | 208 | |
| Michigan | 307 | Reindeer | 143 | |
| Aral Sea | 260 | Tonie Sap | 70 | |
| Tanganyika | 420 | Turkana | 154 | |
| Baykal | 395 | lssykKul | 115 | |
| Great Bear | 192 | Torrens | 130 | |
| Nyasa | 360 | Vanern | 91 | |
| Great Slave | 298 | Nettilling | 67 | |
| Erie | 241 | Winnipegosis | 141 | |
| Winnipeg | 266 | Albert | 100 | |
| Ontario | 193 | Nipigon | 72 | |
| Balkhash | 376 | Gairdner | 90 | |
| Ladoga | 124 | Urmia | 90 | |
| Maracaibo | 133 | Manitoba | 140 | |
| Onega | 145 | Chad | 175 | |
| Eyre | 90 | |||
Calculation:
From the two graphs it is clear that the data is skewed to the right.
Thus, the data is skewed.
Want to see more full solutions like this?
Chapter 1 Solutions
Introduction to Probability and Statistics


 Glencoe Algebra 1, Student Edition, 9780079039897...AlgebraISBN:9780079039897Author:CarterPublisher:McGraw Hill
 Holt Mcdougal Larson Pre-algebra: Student Edition...AlgebraISBN:9780547587776Author:HOLT MCDOUGALPublisher:HOLT MCDOUGAL
 Algebra: Structure And Method, Book 1AlgebraISBN:9780395977224Author:Richard G. Brown, Mary P. Dolciani, Robert H. Sorgenfrey, William L. ColePublisher:McDougal Littell