
EBK STATISTICS FOR BUSINESS & ECONOMICS
12th Edition
ISBN: 9780100460461
Author: Anderson
Publisher: YUZU
expand_more
expand_more
format_list_bulleted
Videos
Textbook Question
Chapter 1, Problem 13SE
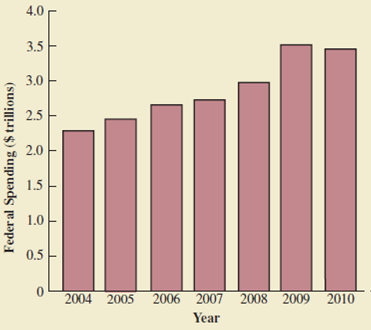
Figure 1.8 provides a bar chart showing the amount of federal spending for the years 2004 to 2010 (Congressional Budget Office website, May 15, 2011).
- a. What is the variable of interest?
- b. Are the data categorical or quantitative?
- c. Are the data time series or cross-sectional?
- d. Comment on the trend in federal spending over time.
FIGURE 1.8 FEDERAL SPENDING
Expert Solution & Answer

Trending nowThis is a popular solution!

Chapter 1 Solutions
EBK STATISTICS FOR BUSINESS & ECONOMICS
Ch. 1 - Discuss the differences between statistics as...Ch. 1 - The U.S. Department of Energy provides fuel...Ch. 1 - Refer to Table 1.6. a. What is the average miles...Ch. 1 - Table 1.7 shows data for seven colleges and...Ch. 1 - Consider the data set in Table 1.7 a. Compute the...Ch. 1 - Foreign Affairs magazine conducted a survey to...Ch. 1 - The Kroger Company is one of the largest grocery...Ch. 1 - The FinancialTimes/Harris Poll is a monthly online...Ch. 1 - The Commerce Department reported receiving the...Ch. 1 - The Bureau of Transportation Statistics Omnibus...
Ch. 1 - J.D. Power and Associates conducts vehicle quality...Ch. 1 - The Hawaii Visitors Bureau collects data on...Ch. 1 - Figure 1.8 provides a bar chart showing the amount...Ch. 1 - The following data show the number of rental cars...Ch. 1 - Every year, the U.S. Coast Guard collects data and...Ch. 1 - A manager of a large corporation recommends a...Ch. 1 - A random telephone survey of 1021 adults (aged 18...Ch. 1 - A Bloomberg Businessweek North American subscriber...Ch. 1 - A survey of 131 investment managers in Barrons Big...Ch. 1 - A seven-year medical research study reported that...Ch. 1 - The Nielsen Company surveyed consumers in 47...Ch. 1 - Pew Research Center is a nonpartisan polling...Ch. 1 - A sample of midterm grades for five students...Ch. 1 - Table 1.8 shows a data set containing information...
Knowledge Booster


Learn more about
Need a deep-dive on the concept behind this application? Look no further. Learn more about this topic, statistics and related others by exploring similar questions and additional content below.Similar questions
Recommended textbooks for you
 Glencoe Algebra 1, Student Edition, 9780079039897...AlgebraISBN:9780079039897Author:CarterPublisher:McGraw Hill
 Trigonometry (MindTap Course List)TrigonometryISBN:9781305652224Author:Charles P. McKeague, Mark D. TurnerPublisher:Cengage Learning
 Holt Mcdougal Larson Pre-algebra: Student Edition...AlgebraISBN:9780547587776Author:HOLT MCDOUGALPublisher:HOLT MCDOUGAL
 College Algebra (MindTap Course List)AlgebraISBN:9781305652231Author:R. David Gustafson, Jeff HughesPublisher:Cengage Learning
 Algebra: Structure And Method, Book 1AlgebraISBN:9780395977224Author:Richard G. Brown, Mary P. Dolciani, Robert H. Sorgenfrey, William L. ColePublisher:McDougal Littell
Glencoe Algebra 1, Student Edition, 9780079039897...
Algebra
ISBN:9780079039897
Author:Carter
Publisher:McGraw Hill
Trigonometry (MindTap Course List)
Trigonometry
ISBN:9781305652224
Author:Charles P. McKeague, Mark D. Turner
Publisher:Cengage Learning
Holt Mcdougal Larson Pre-algebra: Student Edition...
Algebra
ISBN:9780547587776
Author:HOLT MCDOUGAL
Publisher:HOLT MCDOUGAL
College Algebra (MindTap Course List)
Algebra
ISBN:9781305652231
Author:R. David Gustafson, Jeff Hughes
Publisher:Cengage Learning
Algebra: Structure And Method, Book 1
Algebra
ISBN:9780395977224
Author:Richard G. Brown, Mary P. Dolciani, Robert H. Sorgenfrey, William L. Cole
Publisher:McDougal Littell
Time Series Analysis Theory & Uni-variate Forecasting Techniques; Author: Analytics University;https://www.youtube.com/watch?v=_X5q9FYLGxM;License: Standard YouTube License, CC-BY
Operations management 101: Time-series, forecasting introduction; Author: Brandoz Foltz;https://www.youtube.com/watch?v=EaqZP36ool8;License: Standard YouTube License, CC-BY