Essentials of Modern Business Statistics with Microsoft Office Excel (Book Only)
7th Edition
ISBN: 9781337298353
Author: David R. Anderson, Dennis J. Sweeney, Thomas A. Williams
Publisher: South-Western College Pub
expand_more
expand_more
format_list_bulleted
Textbook Question
Chapter 1, Problem 13SE
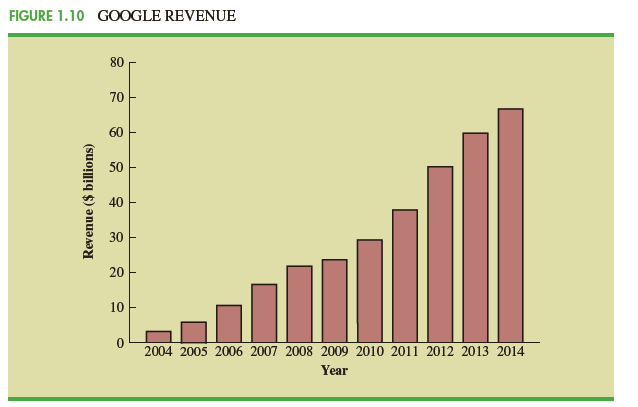
Figure 1. 10 provides a bar chart showing the annual revenue for Google from 2004 to 2014. (The Wall Street Journal, August 19, 2014).
a. What is the variable of interest?
b. Are the data categorical quantitative?
c. Are the data time series or cross-sectional?
d. Comment on the trend in Google revenue over time.

Expert Solution & Answer
Trending nowThis is a popular solution!

Students have asked these similar questions
The creator of a new online multiplayer survival game has been tracking the monthly downloads of the game. The following table shows the monthly downloads (in thousands) for each month of the current and previous year.
Click on the datafile logo to reference the data.
The datafile logo.
Month
Downloads
Month
Downloads
(previous year)
(thousands)
(current year)
(thousands)
February
33.0
January
31.0
March
34.0
February
32.0
April
34.0
March
33.0
May
31.0
April
34.0
June
32.0
May
33.0
July
33.0
June
32.0
August
35.0
July
35.0
September
36.0
August
33.0
October
37.0
September
33.0
November
34.0
October
31.0
December
35.0
a. Compute the mean, median, and mode for number of downloads in the previous year.
Mean (to 3 decimals)
thousand
Median (to 2 decimal)
thousand
Mode (to 2 decimal)
thousand
b. Compute the mean, median, and mode for number of downloads in the current year.
Mean (to 3 decimals)
thousand
Median (to 2…
Edit
Amex PLC has gathered following information on the sales of face mask from April 2020 to
September 2020.
Month Sales ($)
April 17,000
May 18,000
June 19,500
July 22,000
August 21,000
September 23,000
You are required to3;
a. Using linear trend equation forecast the sales of face masks for October 2020.
Please give correct answer ASAP.
Chapter 1 Solutions
Essentials of Modern Business Statistics with Microsoft Office Excel (Book Only)
Ch. 1 - Discuss the differences between statistics as...Ch. 1 - Tablet PC Comparison provides a wide variety of...Ch. 1 - Refer to Table 1. 6. a. What is the average cost...Ch. 1 - Table 1. 7 shows data for eight cordless...Ch. 1 - Refer to the data set in Table 1. 7. a. What is...Ch. 1 - J D. Power and Associates surveys new automobile...Ch. 1 - The Kroger Company is one of the largest grocery...Ch. 1 - The Tennessean, an online newspaper located in...Ch. 1 - The Commerce Department reported receiving the...Ch. 1 - The Bureau of Transportation Statistics Omnibus...
Ch. 1 - In a Gallup telephone survey conducted on April...Ch. 1 - The Hawaii Visitors Bureau collects data on...Ch. 1 - Figure 1. 10 provides a bar chart showing the...Ch. 1 - The following data show the number of rental cars...Ch. 1 - The U. S. Census Bureau tracks sales per month for...Ch. 1 - The Energy Information Administration of the U. S....Ch. 1 - A manager of a large corporation recommends a...Ch. 1 - A random telephone survey of 1021 adults (aged 18...Ch. 1 - A Bloomberg Businessweek North American subscriber...Ch. 1 - A survey of 131 investment managers in Barron 's...Ch. 1 - A seven-year medical research study reported that...Ch. 1 - A survey conducted by Better Homes and Gardens...Ch. 1 - Pew Research Center is a nonpartisan polling...Ch. 1 - A sample of midterm grades for five students...Ch. 1 - Table 1. 8 shows a data set containing information...
Knowledge Booster
Learn more about
Need a deep-dive on the concept behind this application? Look no further. Learn more about this topic, statistics and related others by exploring similar questions and additional content below.Similar questions
- The Oxford Dictionary defines the word nominal asa value that is “stated or expressed but notnecessarily corresponding exactly to the real value.[18]Develop a reasonable argument for why the termnominal rate is used to describe the annual percentagerate of an investment account that compoundsinterest.arrow_forwardDoes Table 2 represent a linear function? If so, finda linear equation that models the data.arrow_forwardThe creator of a new online multiplayer survival game has been tracking the monthly downloads of the game. The following table shows the monthly downloads (in thousands) for each month of the current and previous year. Click on the datafile logo to reference the data. Month Downloads Month Downloads (previous year) (thousands) (current year) (thousands) February 33.0 January 37.0 March 34.0 February 35.0 April 34.0 March 37.0 May 32.0 April 38.0 June 32.0 May 35.0 July 35.0 June 36.0 August 35.0 July 35.0 September 37.0 August 35.0 October 37.0 September 34.0 November 36.0 October 31.0 December 34.0 Compute the mean, median, and mode for number of downloads in the previous year. Mean (to 3 decimals) thousand Median (to 2 decimal) thousand Mode (to 2 decimal) thousand…arrow_forward
- The average price (in cents) per pound of sugar observed during the period September 2012 to September 2013 in most US cities is displayed in the line graph provided. What was the percentage increase in the price (in cents) per pound of sugar from November 2012 to January 2013? 18.6 Average price of sugar in US cities 17.8 17.0 16.2 15.4 14.6 13.8 13.0 Sep-12 Nov-12 Dec-12 Jan-13 Mar-13 Apr-13 Feb-13 May-13 Jun-13 Jul-13 Sep-13 Oct-12 Aug-13arrow_forwardAnswer the circled onesarrow_forwardAssume figures were presented for the past 5 years on merchandise sold at Chicago department and discount stores ($ million). Sales in 2018 were $3,214; in 2017, $3,474; in 2016, $3,148;, in 2015, $3,212; and in 2014, $3,276. Using 2014 as the base year, complete a trend analysis. (Round your answers to the nearest whole percent.) 2018 2017 2016 2015 2014 $ 3,474 % $ 3,214 $ 3,148 $ 3,212 3,276 Sales Sales (in percent) % % % %arrow_forward
- What do the Forecast for each year add up to?arrow_forwardIf the EPA sets a level of 0.08 as a maximum safe ozone level, what percent of the total number of days measured on the above graph exceed safe levels?arrow_forwardBelow we list several variables. Which of these variables are quantitative, and which are qualitative?arrow_forward
arrow_back_ios
arrow_forward_ios
Recommended textbooks for you
 Trigonometry (MindTap Course List)TrigonometryISBN:9781337278461Author:Ron LarsonPublisher:Cengage Learning
 Glencoe Algebra 1, Student Edition, 9780079039897...AlgebraISBN:9780079039897Author:CarterPublisher:McGraw Hill
 Holt Mcdougal Larson Pre-algebra: Student Edition...AlgebraISBN:9780547587776Author:HOLT MCDOUGALPublisher:HOLT MCDOUGAL
 Big Ideas Math A Bridge To Success Algebra 1: Stu...AlgebraISBN:9781680331141Author:HOUGHTON MIFFLIN HARCOURTPublisher:Houghton Mifflin Harcourt

Trigonometry (MindTap Course List)
Trigonometry
ISBN:9781337278461
Author:Ron Larson
Publisher:Cengage Learning


Glencoe Algebra 1, Student Edition, 9780079039897...
Algebra
ISBN:9780079039897
Author:Carter
Publisher:McGraw Hill

Holt Mcdougal Larson Pre-algebra: Student Edition...
Algebra
ISBN:9780547587776
Author:HOLT MCDOUGAL
Publisher:HOLT MCDOUGAL


Big Ideas Math A Bridge To Success Algebra 1: Stu...
Algebra
ISBN:9781680331141
Author:HOUGHTON MIFFLIN HARCOURT
Publisher:Houghton Mifflin Harcourt
Time Series Analysis Theory & Uni-variate Forecasting Techniques; Author: Analytics University;https://www.youtube.com/watch?v=_X5q9FYLGxM;License: Standard YouTube License, CC-BY
Operations management 101: Time-series, forecasting introduction; Author: Brandoz Foltz;https://www.youtube.com/watch?v=EaqZP36ool8;License: Standard YouTube License, CC-BY