Essentials Of Modern Business Statistics With Microsoft Excel, Loose-leaf Version
7th Edition
ISBN: 9781337298308
Author: David R. Anderson, Dennis J. Sweeney, Thomas A. Williams, Jeffrey D. Camm, James J. Cochran
Publisher: Cengage Learning
expand_more
expand_more
format_list_bulleted
Videos
Textbook Question
Chapter 1, Problem 13SE
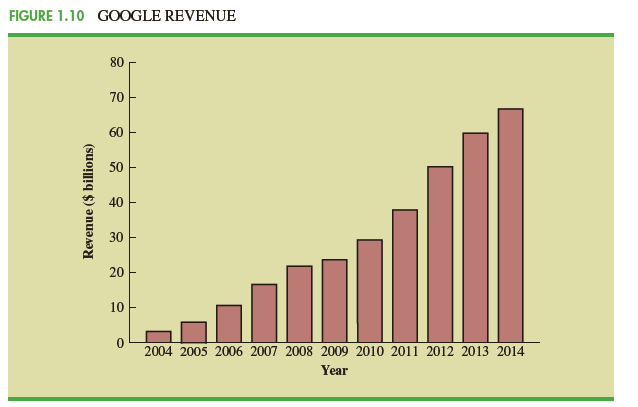
Figure 1. 10 provides a bar chart showing the annual revenue for Google from 2004 to 2014. (The Wall Street Journal, August 19, 2014).
a. What is the variable of interest?
b. Are the data categorical quantitative?
c. Are the data time series or cross-sectional?
d. Comment on the trend in Google revenue over time.
Expert Solution & Answer

Trending nowThis is a popular solution!

Chapter 1 Solutions
Essentials Of Modern Business Statistics With Microsoft Excel, Loose-leaf Version
Ch. 1 - Discuss the differences between statistics as...Ch. 1 - Tablet PC Comparison provides a wide variety of...Ch. 1 - Refer to Table 1. 6. a. What is the average cost...Ch. 1 - Table 1. 7 shows data for eight cordless...Ch. 1 - Refer to the data set in Table 1. 7. a. What is...Ch. 1 - J D. Power and Associates surveys new automobile...Ch. 1 - The Kroger Company is one of the largest grocery...Ch. 1 - The Tennessean, an online newspaper located in...Ch. 1 - The Commerce Department reported receiving the...Ch. 1 - The Bureau of Transportation Statistics Omnibus...
Ch. 1 - In a Gallup telephone survey conducted on April...Ch. 1 - The Hawaii Visitors Bureau collects data on...Ch. 1 - Figure 1. 10 provides a bar chart showing the...Ch. 1 - The following data show the number of rental cars...Ch. 1 - The U. S. Census Bureau tracks sales per month for...Ch. 1 - The Energy Information Administration of the U. S....Ch. 1 - A manager of a large corporation recommends a...Ch. 1 - A random telephone survey of 1021 adults (aged 18...Ch. 1 - A Bloomberg Businessweek North American subscriber...Ch. 1 - A survey of 131 investment managers in Barron 's...Ch. 1 - A seven-year medical research study reported that...Ch. 1 - A survey conducted by Better Homes and Gardens...Ch. 1 - Pew Research Center is a nonpartisan polling...Ch. 1 - A sample of midterm grades for five students...Ch. 1 - Table 1. 8 shows a data set containing information...
Knowledge Booster


Learn more about
Need a deep-dive on the concept behind this application? Look no further. Learn more about this topic, statistics and related others by exploring similar questions and additional content below.Recommended textbooks for you
 College Algebra (MindTap Course List)AlgebraISBN:9781305652231Author:R. David Gustafson, Jeff HughesPublisher:Cengage Learning
 Glencoe Algebra 1, Student Edition, 9780079039897...AlgebraISBN:9780079039897Author:CarterPublisher:McGraw Hill
 Big Ideas Math A Bridge To Success Algebra 1: Stu...AlgebraISBN:9781680331141Author:HOUGHTON MIFFLIN HARCOURTPublisher:Houghton Mifflin Harcourt
 Functions and Change: A Modeling Approach to Coll...AlgebraISBN:9781337111348Author:Bruce Crauder, Benny Evans, Alan NoellPublisher:Cengage Learning
College Algebra (MindTap Course List)
Algebra
ISBN:9781305652231
Author:R. David Gustafson, Jeff Hughes
Publisher:Cengage Learning
Glencoe Algebra 1, Student Edition, 9780079039897...
Algebra
ISBN:9780079039897
Author:Carter
Publisher:McGraw Hill
Big Ideas Math A Bridge To Success Algebra 1: Stu...
Algebra
ISBN:9781680331141
Author:HOUGHTON MIFFLIN HARCOURT
Publisher:Houghton Mifflin Harcourt
Functions and Change: A Modeling Approach to Coll...
Algebra
ISBN:9781337111348
Author:Bruce Crauder, Benny Evans, Alan Noell
Publisher:Cengage Learning
Time Series Analysis Theory & Uni-variate Forecasting Techniques; Author: Analytics University;https://www.youtube.com/watch?v=_X5q9FYLGxM;License: Standard YouTube License, CC-BY
Operations management 101: Time-series, forecasting introduction; Author: Brandoz Foltz;https://www.youtube.com/watch?v=EaqZP36ool8;License: Standard YouTube License, CC-BY