Videos
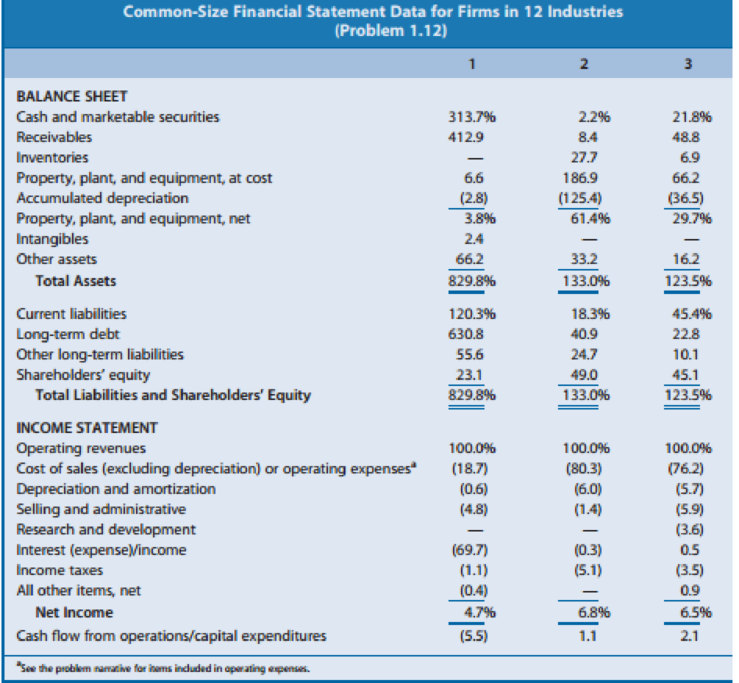
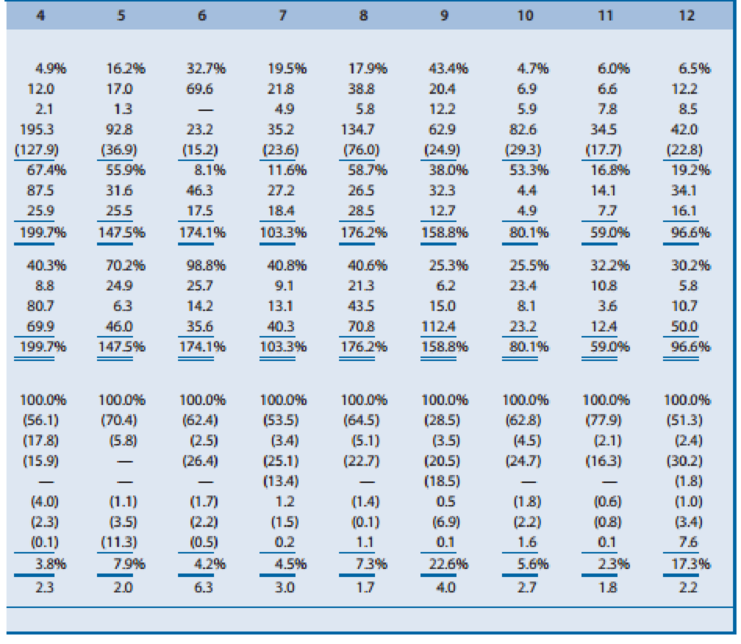
Effect of Industry Characteristics on Financial Statement Relations: A Global Perspective. Effective financial statement analysis requires an understanding of a firm’s economic characteristics. The relations between various financial statement items provide evidence of many of these economic characteristics. Exhibit 1.24 (pages 66–67) presents common-size condensed balance sheets and income statements for 12 firms in different industries. These common-size balance sheets and income statements express various items as a percentage of operating revenues. (That is, the statement divides all amounts by operating revenues for the year.) A dash for a particular financial statement item does not necessarily mean the amount is zero. It merely indicates that the amount is not sufficiently large for the firm to disclose it. A list of the 12 companies, the country of their headquarters, and a brief description of their activities follow.
- A. Accor (France): World’s largest hotel group, operating hotels under the names of Sofitel, Novotel, Motel 6, and others. Accor has grown in recent years by acquiring established hotel chains.
- B. Carrefour (France): Operates grocery supermarkets and hypermarkets in Europe, Latin America, and Asia.
- C. Deutsche Telekom (Germany): Europe’s largest provider of wired and wireless telecommunication services. The telecommunications industry has experienced increased deregulation in recent years.
- D. E.ON AG (Germany): One of the major public utility companies in Europe and the world’s largest privately owned energy service provider.
- E. Fortis (Netherlands): Offers insurance and banking services. Operating revenues include insurance premiums received, investment income, and interest revenue on loans. Operating expenses include amounts actually paid or amounts it expects to pay in the future on insurance coverage outstanding during the year.
- F. Interpublic Group (U.S.): Creates advertising copy for clients. Interpublic purchases advertising time and space from various media and sells it to clients. Operating revenues represent the commissions or fees earned for creating advertising copy and selling media time and space. Operating expenses include employee compensation.
- G. Marks & Spencer (U.K.): Operates department stores in England and other retail stores in Europe and the United States. Offers its own credit card for customers’ purchases.
- H. Nestlé (Switzerland): World’s largest food processor, offering prepared foods, coffees, milk-based products, and mineral waters.
- I. Roche Holding (Switzerland): Creates, manufactures, and distributes a wide variety of prescription drugs.
- J. Sumitomo Metal (Japan): Manufacturer and seller of steel sheets and plates and other construction materials.
- K. Sun Microsystems (U.S.): Designs, manufactures, and sells workstations and servers used to maintain integrated computer networks. Sun outsources the manufacture of many of its computer components.
- L. Toyota Motor (Japan): Manufactures automobiles and offers financing services to its customers.
REQUIRED
Use the ratios to match the companies in Exhibit 1.24 with the firms listed above.

Trending nowThis is a popular solution!

Chapter 1 Solutions
EBK FINANCIAL REPORTING, FINANCIAL STAT


- Effect of Industry Characteristics on Financial Statement Relations. Effective financial statement analysis requires an understanding of a firms economic characteristics. The relations between various financial statement items provide evidence of many of these economic characteristics. Exhibit 1.22 (pages 6061) presents common-size condensed balance sheets and income statements for 12 firms in different industries. These common-size balance sheets and income statements express various items as a percentage of operating revenues. (That is, the statement divides all amounts by operating revenues for the year.) Exhibit 1.22 also shows the ratio of cash flow from operations to capital expenditures. A dash for a particular financial statement item does not necessarily mean the amount is zero. It merely indicates that the amount is not sufficiently large enough for the firm to disclose it. Amounts that are not meaningful are shown as n.m. A list of the 12 companies and a brief description of their activities follow. A. Amazon.com: Operates websites to sell a wide variety of products online. The firm operated at a net loss in all years prior to that reported in Exhibit 1.22. B. Carnival Corporation: Owns and operates cruise ships. C. Cisco Systems: Manufactures and sells computer networking and communications products. D. Citigroup: Offers a wide range of financial services in the commercial banking, insurance, and securities business. Operating expenses represent the compensation of employees. E. eBay: Operates an online trading platform for buyers to purchase and sellers to sell a variety of goods. The firm has grown in part by acquiring other companies to enhance or support its online trading platform. F. Goldman Sachs: Offers brokerage and investment banking services. Operating expenses represent the compensation of employees. G. Johnson Johnson: Develops, manufactures, and sells pharmaceutical products, medical equipment, and branded over-the-counter consumer personal care products. H. Kelloggs: Manufactures and distributes cereal and other food products. The firm acquired other branded food companies in recent years. I. MGM Mirage: Owns and operates hotels, casinos, and golf courses. J. Molson Coors: Manufactures and distributes beer. Molson Coors has made minority ownership investments in other beer manufacturers in recent years. K. Verizon: Maintains a telecommunications network and offers telecommunications services. Operating expenses represent the compensation of employees. Verizon has made minority investments in other cellular and wireless providers. L. Yum! Brands: Operates chains of name-brand restaurants, including Taco Bell, KFC, and Pizza Hut. REQUIRED Use the ratios to match the companies in Exhibit 1.22 with the firms listed above.arrow_forwardOne of the most important applications of ratio analysis is to compare a company’s performance with that of other players in the industry or to compare its own performance over a period of time. Such analyses are referred to as a comparative analysis and trend analysis, respectively. A) A common size analysis requires the representation of financial statement data relative to a single financial statement item (or base account or value). What is the most commonly used base item for a common size balance sheet? Net income Earnings before interest and taxes Total assets Net sales Suppose you are conducting an analysis of the financial performance of Blue Hamster Manufacturing Inc. over the past three years. The company did not issue new shares during these three years and has faced some operational difficulties. The company has thus pilot tested some new forecasting strategies for better operations management. You have collected the company’s relevant…arrow_forwardWhat are financial ratios? Using numerical values from financial statements, financial ratios are created to obtain useful information about a company. Using the numbers on a company's balance sheet, income statement, and cash flow statement, quantitative analysis of a company's liquidity, leverage, growth, margins, profitability, rates of return, valuation, and other factors can be performed. Financial analysis ratio is used for 2 main purpose; to track the company’s performance and to make comparative judgements of the company performance. Users from outside: Retail investors, financial analysts, creditors, rivals, tax and regulatory authorities, and industry observers are internal users. Owners, employees, and the management team.arrow_forward
- See Image for Information Compute the following performance indices for both companies: Profit margin Asset turnover Return on Capital Employed (ROCE) Current ratio Debt equity ratio Compare and analyse the performance of the two companies computed in (1) above and explain what the board of Box Limited needs to do to achieve their objective . c. Which other non-financial measures can influence the decision of the board of Box Limited?arrow_forwardIdentify which ratio category is best described in each statement. • Ratios that help determine whether a company can access its cash and pay its short-term obligations are called • Ratios that help determine the efficiency with which a company manages its day-to-day tasks and assets are called asset management ratios. • Ratios that help assess a company's ability to service the interest and repayment obligations on its long-term debt and the degree to which it uses borrowed versus invested financial capital are called ratios. ratios help measure a company's ability to generate income and profits based on its invested capital. ratios examine the market value of a company's share price, its profits and cash dividends, and the book value of the firm's assets and relate them to other data items to determine how the firm is perceived in the stock market. liquidity ratios.arrow_forward1. Which of the following scenarios are the most appropriate applications of financial ratio analysis? I. Direct comparison of profitability between two companies which apply divergent accounting policies. II. Comparison of liquidity between two domestic financial institutions which apply consistent accounting policies. III. Direct comparison of profitability of a company before and after implementation of new accounting standards. IV. Trend analysis of financial ratios of a company across time periods.arrow_forward
- Which statement best describes a financial ratio and financial ratio analysis? A financial ratio simply represents a relationship between 2 or more pieces of financial information; there is one absolute, standard list of ratios that applies to all financial analysis A financial ratio simply represents a relationship between 2 or more pieces of financial information; there is NOT one absolute, standard list of ratios that applies to all financial analysis A financial ratio simply represents a market estimate of a certain aspect of a firm's financial position and the industry's benchmark; there is one absolute, standard list of ratios that applies to all financial analysis A financial ratio simply represents a market estimate of a certain aspect of a firm's financial position and the industry's benchmark; there is NOT one absolute, standard list of ratios that applies to all financial analysisarrow_forwardIndustry-Specific Ratios: Provide an explanation for each of the following Industry-Specific Ratios: 1)Coefficient of variation of operating income. 2)Coefficient of variation of net income 3)Coefficient of variation of revenues 4)Capital adequacy—banks please Citation is required.arrow_forwardperformance of National Company. Comment on overall financial position and financial health of the business. Identify problems and recommend possible solutions, if historical ratios of company are: Ratios201720182019 Current Ratio1.41.51.6 Acid Test Ratio0.850.740.63 Asset Turnover Ratio4 times3.22.5 Inventory Turnover Ratio6 times5.55 Collection Period6 times5.55 Account payable turnover8 times10 times12 times Total Debt to equity Ratio1.381.611.91 Interest cover543.5 Gross Profit Ratio20%22%23% Net Profit Margin8.5%6.7%3.8% Return on Equity20%21%24% Sales Growth Rate8%5%2% P/E Ratio1098 Fixed Asset Utilization Ratio21.71.4arrow_forward
- One of the most important applications of ratio analysis is to compare a company's performance with that of other players in the industry or to compare its own performance over a period of time. Such analyses are referred to as a comparative analysis and trend analysis, respectively. A common size analysis requires the representation of financial statement data relative to a single financial statement item (or base account or value). What is the most commonly used base item for a common size balance sheet? O Earnings before interest and taxes ONet sales ONet income O Total assets Suppose you are conducting an analysis of the financial performance of Cute Camel Woodcraft Company over the past three years. The company did not issue new shares during these three years and has faced some operational difficulties. The company has thus pilot tested some new forecasting strategies for better operations management. You have collected the company's relevant financial data, made reasonable…arrow_forwardOne of the most important applications of ratio analysis is to compare a company’s performance with that of other players in the industry or to compare its own performance over a period of time. Such analyses are referred to as a comparative analysis and trend analysis, respectively. A common size analysis requires the representation of financial statement data relative to a single financial statement item (or base account or value). What is the most commonly used base item for a common size balance sheet? A. Earnings before interest and taxes B. Total assets C. Net sales D. Net income Suppose you are conducting an analysis of the financial performance of Blue Hamster Manufacturing Inc. over the past three years. The company did not issue new shares during these three years and has faced some operational difficulties. The company has thus pilot tested some new forecasting strategies for better operations management. You have collected the company’s…arrow_forwardSee image attached 1.Compare and analyse the performance of the two companies based on their profit margin, asset turnover, ROCE, and debt equity ratio and explain what the board of Box Limited needs to do to achieve their objective . 2. Which other non-financial measures can influence the decision of the board of Box Limited?arrow_forward
 Financial Reporting, Financial Statement Analysis...FinanceISBN:9781285190907Author:James M. Wahlen, Stephen P. Baginski, Mark BradshawPublisher:Cengage Learning
 Cornerstones of Financial AccountingAccountingISBN:9781337690881Author:Jay Rich, Jeff JonesPublisher:Cengage Learning
- Principles of Accounting Volume 2AccountingISBN:9781947172609Author:OpenStaxPublisher:OpenStax College