
Concept explainers
Videos
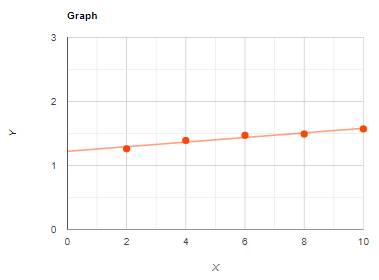
To graph: The equation of line is to be determined.
Explanation of Solution
Given information: Table which shows the movie admissions each year
| Year,
| 0 | 2 | 4 | 6 | 8 | 10 |
| Admissions, | 1.24 | 1.26 | 1.39 | 1.47 | 1.49 | 1.57 |
Graph: For the above given data the equation of line of best fit is
The graph of the above equation as shown below:
Steps to find the equation of line and to draw the graph by using from the table:
Step 1: Enter the data from the given table into two lists.
Step 2: By using the linear regression feature in graphing calculator. The values in equation can be rounded off to obtain
Step 3: Enter the equation
Interpretation:
For the above given data the equation of line of best fit is
Chapter 1 Solutions
BIG IDEAS MATH Algebra 2: Common Core Student Edition 2015


 Algebra and Trigonometry (6th Edition)AlgebraISBN:9780134463216Author:Robert F. BlitzerPublisher:PEARSON
 Contemporary Abstract AlgebraAlgebraISBN:9781305657960Author:Joseph GallianPublisher:Cengage Learning
 Linear Algebra: A Modern IntroductionAlgebraISBN:9781285463247Author:David PoolePublisher:Cengage Learning
 Algebra And Trigonometry (11th Edition)AlgebraISBN:9780135163078Author:Michael SullivanPublisher:PEARSON
 Introduction to Linear Algebra, Fifth EditionAlgebraISBN:9780980232776Author:Gilbert StrangPublisher:Wellesley-Cambridge Press
 College Algebra (Collegiate Math)AlgebraISBN:9780077836344Author:Julie Miller, Donna GerkenPublisher:McGraw-Hill Education