
MATLAB: An Introduction with Applications
6th Edition
ISBN: 9781119256830
Author: Amos Gilat
Publisher: John Wiley & Sons Inc
expand_more
expand_more
format_list_bulleted
Related questions
Question
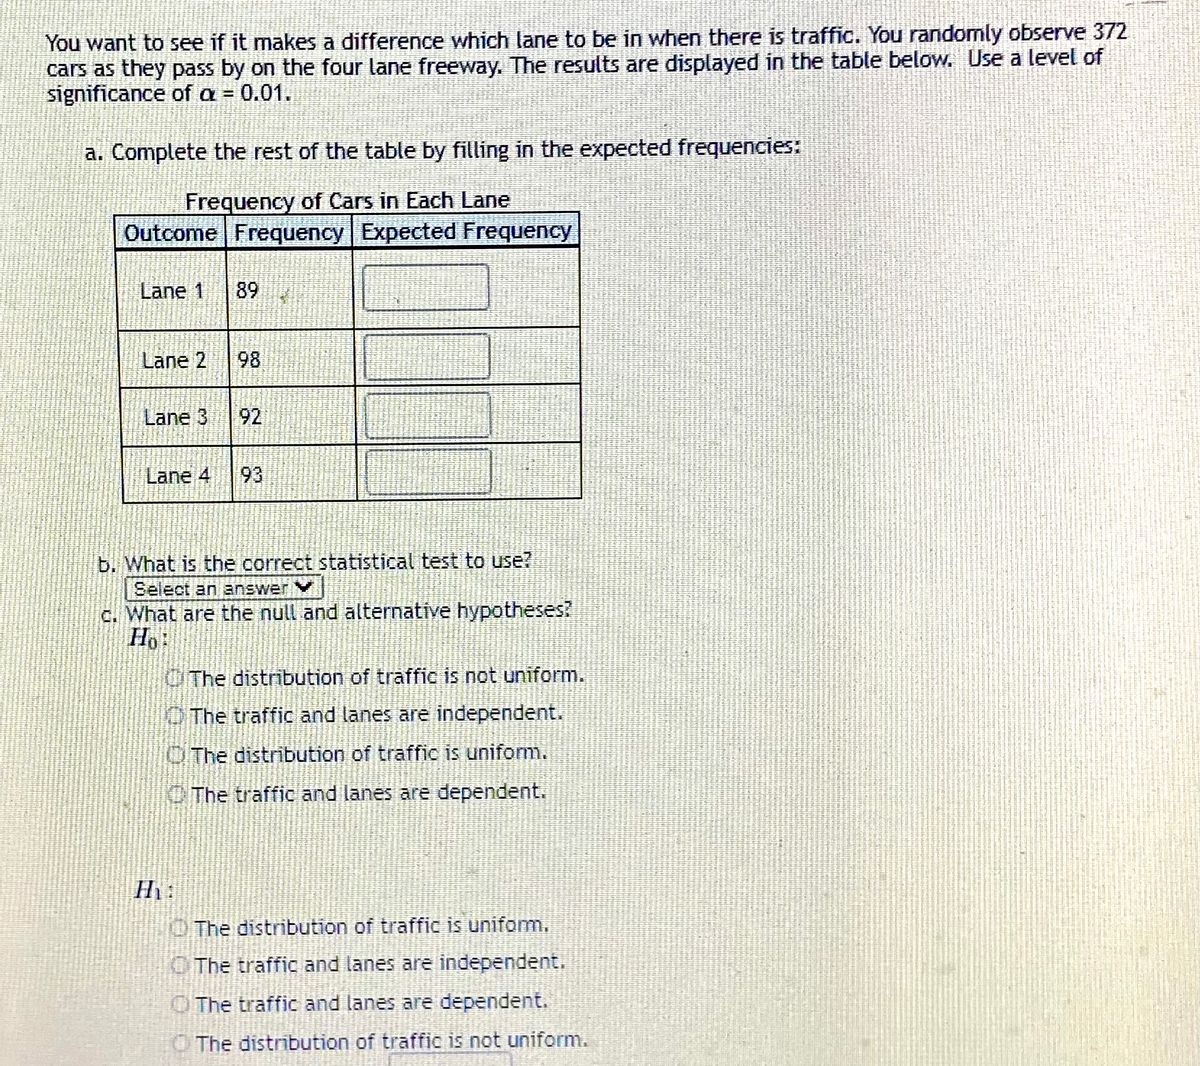

Transcribed Image Text:You want to see if it makes a difference which lane to be in when there is traffic. You randomly observe 372
cars as they pass by on the four lane freeway. The results are displayed in the table below. Use a level of
significance of a = 0.01.
a. Complete the rest of the table by filling in the expected frequencies:
of Cars in Each Lane
Frequency
Outcome Frequency Expected Frequency
Lane 1
89
Lane 2
98
Lane 3
92
Lane 4
93
b. What is the correct statistical test to use?
Select an answer Y
C. What are the null and alternative hypotheses?
Ho:
OThe distribution of traffic is not uniform.
O The traffic and lanes are independent.
O The distribution of traffic is uniform.
KO The traffic and lanes are dependent.
Hi :
OThe distribution of traffic is uniform.
OThe traffic and lanes are independent.
O The traffic and lanes are dependent.
O The distribution of traffic is not uniform.
Expert Solution
This question has been solved!
Explore an expertly crafted, step-by-step solution for a thorough understanding of key concepts.

This is a popular solution

Trending nowThis is a popular solution!

Step by stepSolved in 2 steps with 2 images

Knowledge Booster

Similar questions
- I can't understand why the data is the percentage of surveyed parents.arrow_forwardThe correlation between midterm and final grades for 300 students is 0.620. If 5 points are added to each midterm grade, the new r will be: a. 0.124 b. 0.57 c. 0.62 d. 0.744arrow_forwardJocelyn believes that the amount of sleep she tends to get on weekends differs from the amount of sleep she tends to get during the school week. To investigate this claim, she randomly selects 10 weekend days and 10 school days. She consults her smart watch to determine the number of hours she slept for each of the selected days. Here are the data. School week: 7, 7.5, 8, 6.5, 8, 7.5, 7, 6.5, 7, 8Weekend: 9.5, 9.5, 8.25, 8.5, 7.5, 10.25, 8, 7, 9.5, 10 Jocelyn would like to determine if these data provide convincing evidence that the true mean amount of sleep she gets on the weekend differs from the true mean amount of sleep she gets during the school week. She tests H0: μS – μW = 0, Ha: μS – μW ≠ 0, where μW = the true mean amount of sleep Jocelyn gets on the weekend and μS = the true mean amount of sleep she gets during the school week. The conditions for inference are met. What are the values of the test statistic and P-value for a t-test about a difference in means? Find the…arrow_forward
- You want to see if it makes a difference which lane to be inwhen there is traffic. You randomly observe 296 cars as theypass by on the four lane freeway. The results are displayed inthe table below. Use a level of significance of a = 0.10.a. Complete the rest of the table by filling in theexpected frequencies:Frequency of Cars in Each LaneOutcome Frequency Expected FrequencyLane 173Lane 2Lane 3Lane 4597985arrow_forwardA factory owner has taken a sample (n = 20) of workers to see how many broken widgets each employee produces per day. For the following data, construct a frequency distribution table. Include columns for observed value (Xcat), frequency, proportion, and percent. 2 1 0 2 1 0 7 3 8 0 1 5 0 0 9 2 0 1 3 0arrow_forwardFifty randomly selected car salespersons were asked the number of cars they generally sell in one week. Nine people answered that they generally sell three cars; thirteen generally sell four cars; ten generally sell five cars; seven generally sell six cars; eleven generally sell seven cars. Complete the table. Data Value (# cars) Frequency Relative Frequency Cumulative Relative Frequency 3 4 6. 7arrow_forward
- Listed below are the measured radiation emissions (in W/kg) corresponding to cell phones: A, B, C, D, E, F, G, H, I, J, and K respectively. The media often present reports about the dangers of cell phone radiation as a cause of cancer. Cell phone radiation must be 1.6 W/kg or less. Find the a. mean, b. median, c. midrange, and d. mode for the data. Also complete part e. 0.45 0.77 0.72 0.68 1.53 1.28 0.75 0.99 0.55 0.56 1.12 --..- a. Find the mean. The mean is . (Round to three decimal places as needed.)arrow_forwardA group of students were surveyed about the number of siblings they have. Their responses are summarized in the frequency table below. How many students responded to the survey? Number of Siblings Frequency 0 6 1 8 2 5 3 3 4 1 5 or more 3arrow_forwardFind the percentage of scores of the followingarrow_forward
arrow_back_ios
arrow_forward_ios
Recommended textbooks for you
- MATLAB: An Introduction with ApplicationsStatisticsISBN:9781119256830Author:Amos GilatPublisher:John Wiley & Sons Inc
 Probability and Statistics for Engineering and th...StatisticsISBN:9781305251809Author:Jay L. DevorePublisher:Cengage Learning
 Statistics for The Behavioral Sciences (MindTap C...StatisticsISBN:9781305504912Author:Frederick J Gravetter, Larry B. WallnauPublisher:Cengage Learning
  Elementary Statistics: Picturing the World (7th E...StatisticsISBN:9780134683416Author:Ron Larson, Betsy FarberPublisher:PEARSON
 The Basic Practice of StatisticsStatisticsISBN:9781319042578Author:David S. Moore, William I. Notz, Michael A. FlignerPublisher:W. H. Freeman
 Introduction to the Practice of StatisticsStatisticsISBN:9781319013387Author:David S. Moore, George P. McCabe, Bruce A. CraigPublisher:W. H. Freeman
MATLAB: An Introduction with Applications
Statistics
ISBN:9781119256830
Author:Amos Gilat
Publisher:John Wiley & Sons Inc
Probability and Statistics for Engineering and th...
Statistics
ISBN:9781305251809
Author:Jay L. Devore
Publisher:Cengage Learning
Statistics for The Behavioral Sciences (MindTap C...
Statistics
ISBN:9781305504912
Author:Frederick J Gravetter, Larry B. Wallnau
Publisher:Cengage Learning
Elementary Statistics: Picturing the World (7th E...
Statistics
ISBN:9780134683416
Author:Ron Larson, Betsy Farber
Publisher:PEARSON
The Basic Practice of Statistics
Statistics
ISBN:9781319042578
Author:David S. Moore, William I. Notz, Michael A. Fligner
Publisher:W. H. Freeman
Introduction to the Practice of Statistics
Statistics
ISBN:9781319013387
Author:David S. Moore, George P. McCabe, Bruce A. Craig
Publisher:W. H. Freeman