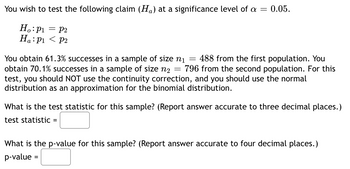
You obtain 61.3% successes in a sample of size n₁ = 488 from the first population. You obtain 70.1% successes in a sample of size n₂ = 796 from the second population. For this test, you should NOT use the continuity correction, and you should use the normal distribution as an approximation for the binomial distribution. What is the test statistic for this sample? (Report answer accurate to three decimal places.) test statistic = What is the p-value for this sample? (Report answer accurate to four decimal places.) p-value =
Q: True or false? The sampling distribution of "1"2 is used to make inferences about degrees of freedom…
A: Given:
Q: The average age at which adolescent girls reach their adult height is 16 years. Now suppose you…
A:
Q: find a 95% confidence interval of the form (0,b) for the variance of the height of children at 3…
A: The data shows the height measurements in centimeters of 5 randomly selected children at ages 3 and…
Q: AMy and Sandy work in a restaurant , the interval of customer show poission distribution wtih rate…
A: GivenThe number of customers arrive per hour =4The time taken for 1 customer to arrive…
Q: Pls help ASAP
A: GivenThe total number of sections in a spinner =8The number of ways to win a panda (two sections 3…
Q: What are the assumptions for regression analysis? Select all that apply. The sample is a random…
A: The assumptions for regression analysis :
Q: The undergraduate grade point averages (UGPA) of students taking an admissions test in a recent year…
A: Solution: Let X be the undergraduate grade point averages of students taking an admissions test in a…
Q: a. For this study, we should use Select an answer b. The null and alternative hypotheses would be:…
A: As per our guidelines, we are allowed to answer three sub-parts. Please post other parts again.…
Q: Pvalue? An unbalancedCRD is performed with a total of800subjects. Three hundred subjects are placed…
A:
Q: Test stastitic for two tailed test of a large smaple means test where the SD of of the population…
A: The test statistic for two tailed test is Z = -2.05
Q: how has the z score been calculated in this, please don't use z table
A: The objective of the question is to find out the warranty period in months that the manufacturer can…
Q: 2. A company produces wires with mean resistance 1 ohm and standard deviation 0.03 ohms. A wire is…
A: Given, μ = 1 σ = 0.03 n = 8
Q: Heights of Volcanoes A random sample of heights (in feet) of active volcanoes in North America,…
A: Given information Population standard deviation, σ = 2385.9 feet Sample size, n = 5
Q: Determine a 95%-confidence interval for u.
A: Given that, Sample size (n) = 16 Sample mean (x¯) = 2.53 Sample variance (σ^2x) = 1.21 Sample…
Q: on of the sample means () as size (n) increases? decreases ncreases hing happens to ;
A: We will check the statement.
Q: REM (rapid eye movement) sleep is sleep during which most dreams occur. Each night a person has both…
A: Given Information: z = 2.46
Q: Which normal distribution should we use to approximate this randomized dotplot? A. N…
A: Mean = 0.0011 ≈0 st. dev. = 0.056
Q: Find the F-test statistic to test the claim that the variances of the two populations are equal.…
A:
Q: Sick Days in Bed A researcher wishes to see if the average number of sick days a worker takes per…
A: Given that Sample size n = 37 Sample mean = 5.4 Population SD = 1.4 Level of significance = 0.01
Q: A researcher found that a cigarette smoker smokes on average 33 cigarettes a day. She feels that…
A: Given info: A researcher found that a cigarette smoker smokes on average 33 cigarettes a day. She…
Q: A quality control expert at LIFE batteries wants to test their new batteries. The design engineer…
A: Given: Variance,σ2=2916 Mean life, μ=518 Total number of samples, n=81To find:…
Q: Below is another student's solution to a normal approximation problem. Identify each step with an…
A: n=50 1 in 5 treasure We have to find the probability that you find 8 rare items in a collection of…
Q: The table below shows the number of hours per day 11 patients suffered from headaches before and…
A: There are two dependent samples which are daily headache hours before and after. We have to test…
Q: How work the prob
A: Step 1: State the null and alternative hypothesis for this testSince we are testing the claim that…
Q: (c) What is the median failure time of a light bulb? (d) What is the hazard rate?
A: From the above given data the following solution is provided below:
Q: Repeated measures study with a total n=24, and a sample mean difference score of MD=4 is obtained.…
A: It is given that Sample size n = 24 Mean difference MD = 4 Variance of differences s2 = 216
Q: You are part of a trivia team and have tracked your team's performance since you started playing, so…
A: Sample size(n)=18sample mean(x¯)=82Population mean(μ)=68population standard deviation(σ)=11
Q: (a) Identify the claim and state Ho and H The claim is "The therapy the length of time patients…
A: Here given claim soft tissue therapy helps to reduce the length of time patients suffer from…
Q: Sick Days in Bed A researcher wishes to see if the average number of sick days a worker takes per…
A:
Q: What are the assumptions for regression analysis? Select all that apply. The sample is a random…
A: The four assumptions for regression analysis are; Linearity: There must be linear relationship…
Q: Sick Days in Bed A researcher wishes to see if the average number of sick days a worker takes per…
A:
Q: Suppose that 40% of Americans drink soda every day. Amy, a researcher at a local university, takes a…
A: Answer:- Here the random variable X has binomial distributionThe sample size is: Probability of…
Q: Last year, a person wrote 134 checks. Let the random variable x represent the number of checks he…
A: Obtain the mean number of chicks written per day. The mean number of chicks written per day is…
Q: You are part of a trivia team and have tracked your team's performance since you started playing, so…
A: Answer: From the given data, population mean(μ) = 78 Sample size(n) = 18 sample mean (x) = 89…
Q: An oceanographer claims that the mean dive duration of a North Atlantic right whale is 11.7 minutes,…
A: The hypothesis test is a statistical method in which one using the sample data try to check the…
Q: Suppose that you want to perform a hypothesis test for a population mean. Assume that the population…
A: For testing population mean: If sample size is small and the population is normally distributed…
Q: You are conducting a study to see if the proportion of voters who prefer Candidate A is…
A: given data claim : p ≠0.27Z = 2.007 p value = ?
Q: calculated that the taxi drivers spent average 9.25 hours in a day assume that the distribution…
A:
Q: ou are conducting a study to see if the proportion of voters who prefer Candidate A is significantly…
A: we have to find p value..
Q: Diet Regular Data on the weights (Ib) of the contents of cans of diet soda versus the contents of…
A:
Q: Confidence intervals are designed to predict where the population mean will fall. We use the Z…
A: A confidence interval is an interval (corresponding to the kind of interval estimators) that has…
Q: The weights of 100 female students aged 15-20 years have a mean of 120 pounds and a standard…
A: "Since you have posted a question with multiple subparts, we will solve first 3 sub-parts for you.…
Q: True or false? If the statement is false, use one or two sentences to justify your answer.
A:
- in a normal distribution , a couple spends = 75.048pounds ,standard devaition =11.55pounds 1 find the prob that the couple spends less than 60 pounds 2 find the prob that random sample of 5 couples will spend less thsn 60 pounds kindly answer both partsA binomial experiment is given. Decide whether you can use the normal distribution to approximate the binomial distribution. If you can, find the mean and standard deviation. If you cannot, explain why. A survey of adults found that 61% have used a multivitamin in the past 12 months. You randomly select 50 adults and ask them if they have used a multivitamin in the past 12 months.Assume the samples are random and independent, the populations are nomally distributed, and the population variances are equal. The table available below shows the prices (in dollars) for a sample of automobile batteries. The prices are classified according to battery type. At a = 0.10, is there enough evidence conclude that at least one mean battery price is different from the others? Complete parts (a) through (e) below. E Click the icon to view the battery cost data. (a) Let u1. P2. H3 represent the mean prices for the group size 35, 65, and 24/24F respectively. Identify the claim and state Ho and H. H Cost of batteries by type The claim is the V hypothesis. Group size 35 Group size 65 Group size 24/24F 101 111 121 124 D 146 173 182 278 124 140 141 89 (b) Find the critical value, Fo, and identify the rejection region. 90 79 84 The rejection region is F Fo, where Fo = (Round to two decimal places as needed.) (c) Find the test statistic F. Print Done F= (Round to two decimal places as…
- ← F2 Researchers conducted a study to determine whether magnets are effective in treating back pain. The results are shown in the table for the treatment (with magnets) group and the sham (or placebo) group. The results are a measure of reduction in back pain. Assume that the two samples are independent simple random samples selected from normally distributed populations, and do not assume that the population standard deviations are equal. Complete parts (a) and (b) below. S a. Use a 0.05 significance level to test the claim that those treated with magnets have a greater mean reduction in pain than those given a sham treatment. What are the null and alternative hypotheses? w an example OC. Ho: H₁ H₂ H₁: Hy H₂ The test statistic, t, is 0.15. (Round to two decimal places as needed.) The P-value is (Round to three decimal places as needed.) 7 W X H 3 Get more help. 80 F3 E D C $ 4 Q F4 R F % 5 V F5 T G 6 B MacBook Air F6 Y H & 7 N F7 U J OB. Ho:H0 , test statistic, and p value pleaseA company that manufactures batteries used in electric cars is reporting that their newest model of battery has a mean lifetime, µ, of 18 years. To test the company's claim, a competitor has selected 56 of these batteries at random. The mean lifetime of the sample is 18.9 years. Suppose the population standard deviation of these lifetimes is known to be 4.8 years. Is there enough evidence to reject the claim that the mean lifetime of the newest model is 18 years? Perform a hypothesis test, using the 0.05 level of significance. (a) State the null hypothesis H, and the alternative hypothesis H,. Ho: 0 OA binomial experiment is given. Decide whether you can use the normal distribution to approximate the binomial distribution. If you can, find the mean and standard deviation. If you cannot, explain why. A survey of adults found that 46% have used a multivitamin in the past 12 months You randomly select 50 adults and ask them past 12 months. they have used a multivitamin in the Select the correct answer below and, if necessary, fill in the answer boxes within your choice O A. No, because np <5. OB. No, because ng <5. O C. Yes, the mean is and the standard deviation is (Round to two decimal places as needed.)This output represents the hypothesis test that the average age at first pregnancy of women diagnosed with breast cancer is different depending on whether or not metastases are present (yes or no) at the time of breast cancer diagnosis.When should a s distribution be used? When there are how many cases in a sample? When should a t distribution be used? When there are how many cases in a sample?Assuming variance > 1, which of the following must be true? The sample variance is calculated based on the sample size rather than the degrees of freedom The data are normally distributed Standard deviation < variance The model will explain more than 50% of the variance of the dependent variableTRUE OR FALSE A type I error occurs when a researcher unknowingly obtains an extreme non-representative example. The null hypothesis should be rejected if the test value is -2.8, a=0.01, and the test is left-tailed. The variance of the standard normal distribution and the t-distribution is 1.I need help only with the lat part of the exerciseRecommended textbooks for youMATLAB: An Introduction with ApplicationsStatisticsISBN:9781119256830Author:Amos GilatPublisher:John Wiley & Sons IncProbability and Statistics for Engineering and th…StatisticsISBN:9781305251809Author:Jay L. DevorePublisher:Cengage LearningStatistics for The Behavioral Sciences (MindTap C…StatisticsISBN:9781305504912Author:Frederick J Gravetter, Larry B. WallnauPublisher:Cengage LearningElementary Statistics: Picturing the World (7th E…StatisticsISBN:9780134683416Author:Ron Larson, Betsy FarberPublisher:PEARSONThe Basic Practice of StatisticsStatisticsISBN:9781319042578Author:David S. Moore, William I. Notz, Michael A. FlignerPublisher:W. H. FreemanIntroduction to the Practice of StatisticsStatisticsISBN:9781319013387Author:David S. Moore, George P. McCabe, Bruce A. CraigPublisher:W. H. FreemanMATLAB: An Introduction with ApplicationsStatisticsISBN:9781119256830Author:Amos GilatPublisher:John Wiley & Sons IncProbability and Statistics for Engineering and th…StatisticsISBN:9781305251809Author:Jay L. DevorePublisher:Cengage LearningStatistics for The Behavioral Sciences (MindTap C…StatisticsISBN:9781305504912Author:Frederick J Gravetter, Larry B. WallnauPublisher:Cengage LearningElementary Statistics: Picturing the World (7th E…StatisticsISBN:9780134683416Author:Ron Larson, Betsy FarberPublisher:PEARSONThe Basic Practice of StatisticsStatisticsISBN:9781319042578Author:David S. Moore, William I. Notz, Michael A. FlignerPublisher:W. H. FreemanIntroduction to the Practice of StatisticsStatisticsISBN:9781319013387Author:David S. Moore, George P. McCabe, Bruce A. CraigPublisher:W. H. Freeman