
MATLAB: An Introduction with Applications
6th Edition
ISBN: 9781119256830
Author: Amos Gilat
Publisher: John Wiley & Sons Inc
expand_more
expand_more
format_list_bulleted
Related questions
Question
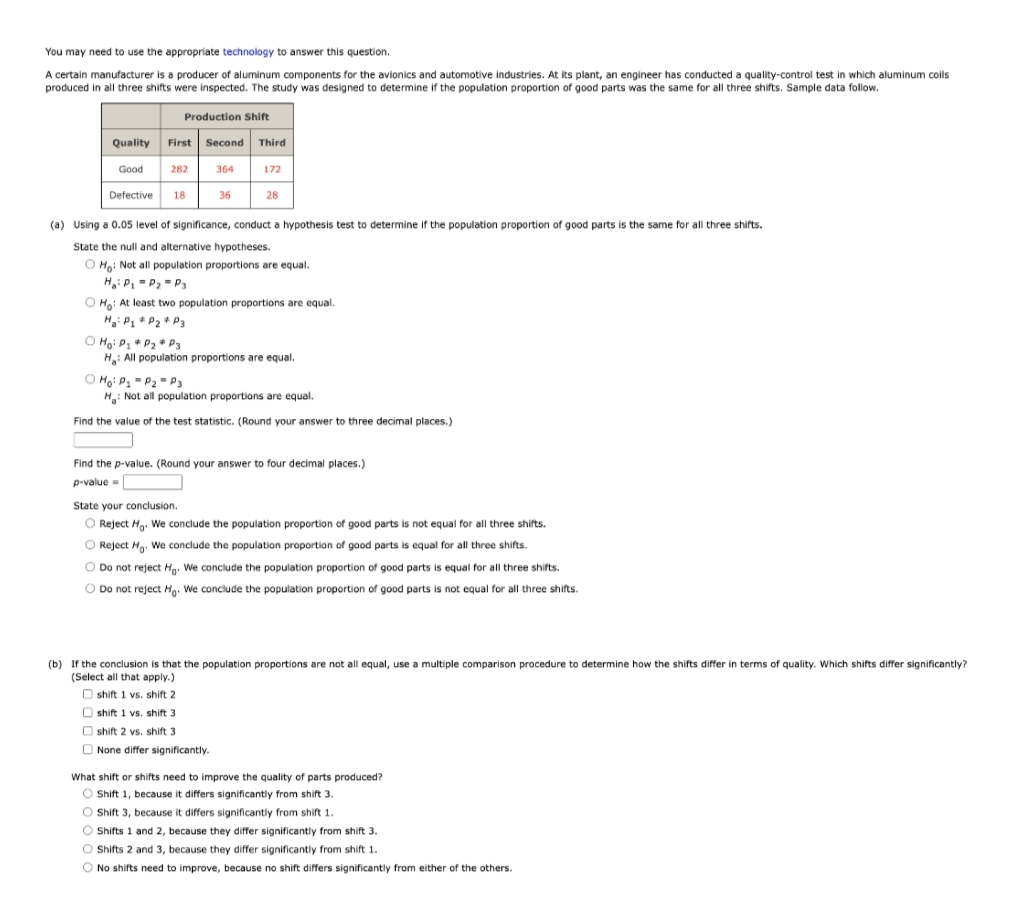

Transcribed Image Text:You may need to use the appropriate technology to answer this question.
A certain manufacturer is a producer of aluminum components for the avionics and automotive industries. At its plant, an engineer has conducted a quality-control test in which aluminum coils
produced in all three shifts were inspected. The study was designed to determine if the population proportion of good parts was the same for all three shifts. Sample data follow.
Production Shift
Quality First second Third
Good
282
364
172
Defective
18
36
28
(a) Using a 0.05 level of significance, conduct a hypothesis test to determine if the population proportion of good parts is the same for all three shifts.
State the null and alternative hypotheses.
O Hại Not all population proportions are equal.
H:P, - P, = P3
O Ho: At least two population proportions are equal.
Ha: P1* P2" P3
O Hgi P, * P2* P3
H: All population proportions are equal.
O Hoi P, - P2 "P3
H: Not all population proportions are equal.
Find the value of the test statistic. (Round your answer to three decimal places.)
Find the p-value. (Round your answer to four decimal places.)
p-value =
State your conclusion.
O Reject Hg. We conclude the population proportion of good parts is not equal for all three shifts.
O Reject Hg. We conclude the population proportion of good parts is equal for all three shifts.
O Do not reject Hg. We conclude the population proportion of good parts is equal for all three shifts.
O Do not reject H. We conclude the population proportion of good parts is not equal for all three shifts.
(b) If the conclusion is that the population proportions are not all equal, use a multiple comparison procedure to determine how the shifts differ in terms of quality. Which shifts differ significantly?
(Select all that apply.)
O shift 1 vs. shift 2
O shift 1 vs. shift 3
shift 2 vs. shift 3
O None differ significantly.
What shift or shifts need to improve the quality of parts produced?
Shift 1, because it differs significantly from shift 3.
O Shift 3, because it differs significantly from shift 1.
O Shifts 1 and 2, because they differ significantly from shift 3.
O Shifts 2 and 3, because they differ significantly from shift 1.
O No shifts need to improve, because no shift differs significantly from either of the others.
Expert Solution
This question has been solved!
Explore an expertly crafted, step-by-step solution for a thorough understanding of key concepts.

Step by stepSolved in 3 steps with 3 images

Knowledge Booster

Similar questions
- A company produces scooters used by small businesses that find them convenient for making short deliveries. The company is notified whenever a scooter breaks down, and the problem is classified as being either mechanical or electrical. The company then matches the scooter to the plant where it was assembled. The data table to the right contains a random sample of 200 breakdowns. Use the data file and the relative frequency assessment method to complete parts a through c. Electrical Mechanical Total Plant 1 21 52 73 Plant 2 74 53 127 Total 95 105 200 a. What is the probability a scooter was assembled at Plant 2? P(Plant 2) = (Type an integer or a decimal.) b. What is the probability that a scooter breakdown was due to a mechanical problem? P(mechanical) =D(Type an integer or a decimal.) c. What is the probability that a scooter breakdown was due to an electrical problem and the scooter was assembled at Plant 2? P(electrical and Plant 2) = (Type an integer or a decimal.)arrow_forwardA company produces scooters used by small businesses that find them convenient for making short deliveries. The company is notified whenever a scooter breaks down, and the problem is classified as being either mechanical or electrical. The company then matches the scooter to the plant where it was assembled. The data table to the right contains a random sample of 200 breakdowns. Use the data file and the relative frequency assessment method to complete parts a through c. Electrical Mechanical Total Plant 1 27 44 71 Plant 2 66 63 129 Total 93 107 200 a. What is the probability a scooter was assembled at Plant 2? P(Plant 2) = (Type an integer or a decimal.) b. What is the probability that a scooter breakdown was due to an electrical problem? P(electrical) = (Type an integer or a decimal.) c. What is the probability that a scooter breakdown was due to a mechanical problem and the scooter was assembled at Plant 1? P(mechanical and Plant 1) = (Type an integer or a decimal.)arrow_forwardEmpathy: The Interpersonal Reactivity Index is a survey designed to assess four different types of empathy. One type of empathy, called Empathetic Concern measures the tendency to feel sympathy and compassion for people who are less fortunate. The index ranges from 0 (less empathetic) to 28 (more empathet The following data, representing random samples of 11 males and 11 females, are consistent with results reported in psychological studies. Boxplots show tha it is reasonable to assume that the populations are approximately normal. Can you conclude that the mean empathy score for men is less than the mean empathy score for women? Let μ₁ denote the mean empathy score for males and μ₂ denote the mean empathy score for females. Use the a=0.01 level and the critical value method with the table. 12 16 13 26 21 23 8 15 18 25 15 Males 21 23 15 26 25 28 24 16 19 20 23 Females Part 1 of 6 Send data to Excel State the appropriate null and alternate hypotheses. H₁ | M₁ = μ₂ H₁ :|µ₁ <µ₂ This is a…arrow_forward
- Which one of these is NOT something that would be included in the Methods section of a research report? a. data regarding the reliability and validity of any measures used b. information regarding preregistration of the study c. details of the statistical analyses d. justification for sample size used in the studyarrow_forwardA professor wants to know which type of instructional mode students had more satisfaction. The professor randomly selected n = 5 students from each of the following types of classes: online only, hybrid, and face-to face only. Student were given a satisfaction survey. Are their differences in student satisfaction among the different instructional modes. The data are below: Online Hybrid Face-to-Face 3 3 4 3 3 1 3 1 3 2 2 2 2 1 3 Calculate Mean Square Within Group (MSWG)arrow_forwardA researcher wanted to test whether there is a relationship between preferred sweet (Oreo cookies, Mars bars, or Twinkies) and age group (children, adolescents, or young adults). To test that, subjects from the three age groups were asked which of the three sweets they preferred. Which statistical test should be used to analyze the data? 1. chi square test of independece 2. chi square test for goodness of fit 3. one sample t test 4. one way anova testarrow_forward
- You may need to use the appropriate technology to answer this question. Forty-minute workouts of one of the following activities three days a week will lead to a loss of weight. Suppose the following sample data show the number of calories burned during 40-minute workouts for three different activities. Swimming Tennis Cycling 403 420 390 375 490 255 430 445 300 405 415 407 422 525 263 Find the value of the test statistic. Find the p-value. (Round your answer to three decimal places.)arrow_forwardThe National Association of Home Builders provided data on the cost of the most popular home remodeling projects. Sample data on cost in thousands of dollars for two types of remodeling projects are as follows. Excel File: data 10-41.xlsx Kitchen 25.2 17.4 22.8 21.9 19.7 Master Bedroom 18.0 22.9 26.4 24.8 26.9 Kitchen 23.0 19.7 16.9 21.8 23.6 Master Bedroom 17.8 24.6 21.0 a. Develop a point estimate of the difference between the population mean remodeling costs of kitchens and master bedrooms. (Enter negative values as negative numbers. Report in thousands of dollars with no commas in your answer.) Point estimate = $ thousand b. Develop a 90% confidence interval for the difference between the two population means. (to 1 decimal and enter negative values as negative numbers) ) in thousands of dollars.arrow_forwardA source table has the following information: Three treatment conditions with a sample of n =7 participants in each treatment. You know SS(BW) = 20 and MS(WI) = 2. What is the missing value for MS(BW)? Answer choices: 40, 10, 2, 5 You have an ANOVA source table with the following information: Three treatment groups with a sample of n = 10 participants in each treatment. You also know the SS(BW) =20 and F = 5.00. What is the missing value for SS(Total)? Answer choices: 74, 54, 30, 22 For an experiment involving 2 levels of factor A and 3 levels of factor B with a sample of n = 5 in each treatment condition, what is the value for df(WI)? Answer choices: 30, 29, 24, 20arrow_forward
- The age of first marriage for women who responded to a survey by the CDC between 2006 and 2010 is used here. The women who first married in their twenties were randomly divided into three groups: A, B, and C. The ANOVA output is supplied below: Count NAS (Missings) 3773 group Count A 1288 B 1246 C 1239 Frequency Source DF 2 group Residual 3770 28 26 24 Response Variable (age) Summary Mean 22 20 T 0 Group Variable Summary NAS Mean (Missings) 23.73787 A 0 23.76941 0 23.77929 0 23.66344 ANOVA Table: age-group Sum of Squares 10.283 26969 Mean Square Std. Dev. Std. Dev. 2.674442 B F Value Pr>F MSG 0.71875 0.48743 MSE Age of First Marriage in 20's 2.728097 2.664101 2.628699 Carrow_forwardWhat type of study is this? A first-year university unit wanted to give option of online teaching to determine whether online teaching improved learning outcomes. Students were allowed to enrol into online or on-campus classes. Grades at the end of semester were compared. Select one: O Experimental O Something else O Observationalarrow_forwarda) Work this problem manually (by hand) using the procedures and formulas for ANOVA to check if the Population Means for flying time before major maintenance is required are the same for the three types of aircraft. To help you, Sample Means and Sample Variances have been calculated below for you: Airbus Boeing737 Boeing 787 6.4 8.7 9.9 7.8 7.4 12.8 5.3 9.4 12.1 7.4 10.1 10.8 8.4 9.2 11.3 7.3 9.8 11.5 __________________________________________________________________ Sample Mean 7.1…arrow_forward
arrow_back_ios
SEE MORE QUESTIONS
arrow_forward_ios
Recommended textbooks for you
- MATLAB: An Introduction with ApplicationsStatisticsISBN:9781119256830Author:Amos GilatPublisher:John Wiley & Sons Inc
 Probability and Statistics for Engineering and th...StatisticsISBN:9781305251809Author:Jay L. DevorePublisher:Cengage Learning
 Statistics for The Behavioral Sciences (MindTap C...StatisticsISBN:9781305504912Author:Frederick J Gravetter, Larry B. WallnauPublisher:Cengage Learning
  Elementary Statistics: Picturing the World (7th E...StatisticsISBN:9780134683416Author:Ron Larson, Betsy FarberPublisher:PEARSON
 The Basic Practice of StatisticsStatisticsISBN:9781319042578Author:David S. Moore, William I. Notz, Michael A. FlignerPublisher:W. H. Freeman
 Introduction to the Practice of StatisticsStatisticsISBN:9781319013387Author:David S. Moore, George P. McCabe, Bruce A. CraigPublisher:W. H. Freeman
MATLAB: An Introduction with Applications
Statistics
ISBN:9781119256830
Author:Amos Gilat
Publisher:John Wiley & Sons Inc
Probability and Statistics for Engineering and th...
Statistics
ISBN:9781305251809
Author:Jay L. Devore
Publisher:Cengage Learning
Statistics for The Behavioral Sciences (MindTap C...
Statistics
ISBN:9781305504912
Author:Frederick J Gravetter, Larry B. Wallnau
Publisher:Cengage Learning
Elementary Statistics: Picturing the World (7th E...
Statistics
ISBN:9780134683416
Author:Ron Larson, Betsy Farber
Publisher:PEARSON
The Basic Practice of Statistics
Statistics
ISBN:9781319042578
Author:David S. Moore, William I. Notz, Michael A. Fligner
Publisher:W. H. Freeman
Introduction to the Practice of Statistics
Statistics
ISBN:9781319013387
Author:David S. Moore, George P. McCabe, Bruce A. Craig
Publisher:W. H. Freeman