
MATLAB: An Introduction with Applications
6th Edition
ISBN: 9781119256830
Author: Amos Gilat
Publisher: John Wiley & Sons Inc
expand_more
expand_more
format_list_bulleted
Related questions
Question
I need help with 5.
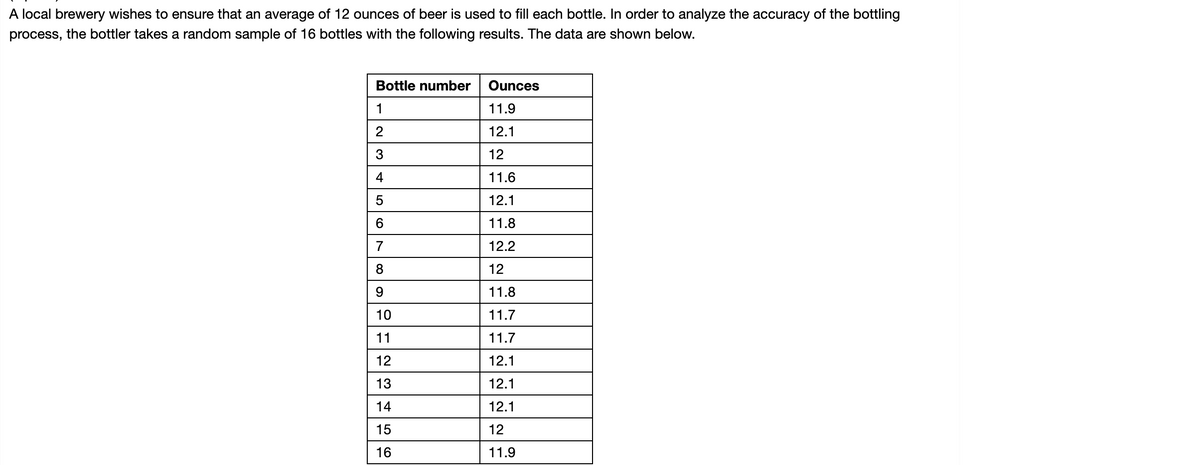

Transcribed Image Text:A local brewery wishes to ensure that an average of 12 ounces of beer is used to fill each bottle. In order to analyze the accuracy of the bottling
process, the bottler takes a random sample of 16 bottles with the following results. The data are shown below.
Bottle number
Ounces
1
11.9
2
12.1
3
12
4
11.6
5
12.1
11.8
7
12.2
8
12
9.
11.8
10
11.7
11
11.7
12
12.1
13
12.1
14
12.1
15
12
16
11.9

Transcribed Image Text:3. Assume the correct conditions have been met and calculate the test statistic.
V =
-1.259
4. What are the degrees of freedom for this test?
df =
15
5. Calculate the p-value.
p-value = 0.2997
Expert Solution
This question has been solved!
Explore an expertly crafted, step-by-step solution for a thorough understanding of key concepts.

Step by stepSolved in 2 steps with 1 images

Knowledge Booster


Learn more about
Need a deep-dive on the concept behind this application? Look no further. Learn more about this topic, statistics and related others by exploring similar questions and additional content below.Similar questions
- If you have a 12 can of pepi box and a 12 can of coca cola box what uses more cardboardarrow_forwardwhat is the soulition to 4x + 3 > -5arrow_forward1) The distribution of vocabulary scores for seventh-graders in Indiana is N(6.84, 1.552). a) Sketch a normal curve for this distribution of vocabulary scores. Label the points that are 1, 2, and 3 standard deviations from the mean. b) What percent of the vocabulary scores are less than 3.74? c) What percent of scores are between 5.29 and 9.94?arrow_forward
arrow_back_ios
SEE MORE QUESTIONS
arrow_forward_ios
Recommended textbooks for you
- MATLAB: An Introduction with ApplicationsStatisticsISBN:9781119256830Author:Amos GilatPublisher:John Wiley & Sons Inc
 Probability and Statistics for Engineering and th...StatisticsISBN:9781305251809Author:Jay L. DevorePublisher:Cengage Learning
 Statistics for The Behavioral Sciences (MindTap C...StatisticsISBN:9781305504912Author:Frederick J Gravetter, Larry B. WallnauPublisher:Cengage Learning
  Elementary Statistics: Picturing the World (7th E...StatisticsISBN:9780134683416Author:Ron Larson, Betsy FarberPublisher:PEARSON
 The Basic Practice of StatisticsStatisticsISBN:9781319042578Author:David S. Moore, William I. Notz, Michael A. FlignerPublisher:W. H. Freeman
 Introduction to the Practice of StatisticsStatisticsISBN:9781319013387Author:David S. Moore, George P. McCabe, Bruce A. CraigPublisher:W. H. Freeman
MATLAB: An Introduction with Applications
Statistics
ISBN:9781119256830
Author:Amos Gilat
Publisher:John Wiley & Sons Inc
Probability and Statistics for Engineering and th...
Statistics
ISBN:9781305251809
Author:Jay L. Devore
Publisher:Cengage Learning
Statistics for The Behavioral Sciences (MindTap C...
Statistics
ISBN:9781305504912
Author:Frederick J Gravetter, Larry B. Wallnau
Publisher:Cengage Learning
Elementary Statistics: Picturing the World (7th E...
Statistics
ISBN:9780134683416
Author:Ron Larson, Betsy Farber
Publisher:PEARSON
The Basic Practice of Statistics
Statistics
ISBN:9781319042578
Author:David S. Moore, William I. Notz, Michael A. Fligner
Publisher:W. H. Freeman
Introduction to the Practice of Statistics
Statistics
ISBN:9781319013387
Author:David S. Moore, George P. McCabe, Bruce A. Craig
Publisher:W. H. Freeman