MATLAB: An Introduction with Applications
6th Edition
ISBN: 9781119256830
Author: Amos Gilat
Publisher: John Wiley & Sons Inc
expand_more
expand_more
format_list_bulleted
Question

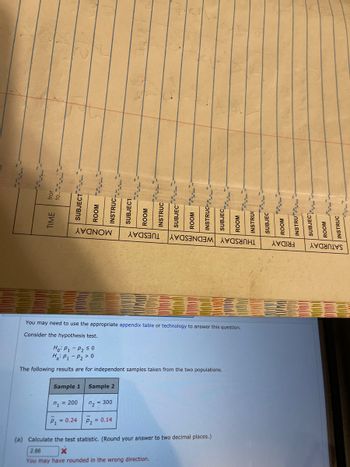
Transcribed Image Text:The image contains two sections.
### 1. Schedule Table
- **Days of the Week:** The table lists days from Monday to Saturday.
- **Columns:**
- TIME
- SUBJECT
- ROOM
- INSTR (Instructor)
Each day has its own set of columns labeled as above, possibly for scheduling classes.
### 2. Hypothesis Test Example
Below the table, there is a statistical test question and calculation:
- **Hypothesis Test:**
- Null Hypothesis (H0): \( p_1 - p_2 \leq 0 \)
- Alternative Hypothesis (H1): \( p_1 - p_2 > 0 \)
- **Sample Results:**
- Sample 1:
- \( n_1 = 200 \)
- \( \hat{p}_1 = 0.24 \)
- Sample 2:
- \( n_2 = 300 \)
- \( \hat{p}_2 = 0.14 \)
- **Task:**
- Calculate the test statistic (Round the answer to two decimal places).
- Calculation shown as "2.86" marked with an X, indicating a possible error: "You may have rounded in the wrong direction."
This section illustrates the process of conducting and calculating a hypothesis test with given sample data.
Expert Solution
This question has been solved!
Explore an expertly crafted, step-by-step solution for a thorough understanding of key concepts.
Step by stepSolved in 4 steps with 3 images

Knowledge Booster
Similar questions
- Please answer a-Garrow_forwardAnswer the following statistic questions on house prices, use the information below as reference.arrow_forwardThe population standard deviation for the height of high school basketball players is 3.0 inches. If we want to be 99% confident that the sample mean height is within 1.5 inch of the true population mean height, how many randomly selected students must be surveyed? (When you find your critical value, round to 2 places) n=arrow_forward
- Choose the appropriate statistical test. When computing, be sure to round each answer as indicated. A dentist wonders if depression affects ratings of tooth pain. In the general population, using a scale of 1-10 with higher values indicating more pain, the average pain rating for patients with toothaches is 6.8. A sample of 30 patients that show high levels of depression have an average pain rating of 7.1 (variance 0.8). What should the dentist determine? 1. Calculate the estimated standard error. (round to 3 decimals). [st.error] 2. What is thet-obtained? (round to 3 decimals). 3. What is the t-cv? (exact value) 4. What is your conclusion? Only type "Reject" or Retain"arrow_forwardUse the sample data below to test the hypotheses Comparison 1 vs 2 1 vs 3 2 vs 3 Pi Pj |Absolutel Difference ni Response Yes No Ho: P1 P2 P3 Ha Not all population proportions are the same nj 1 Critical Value 150 100 Populations where p, is the population proportion of yes responses for population i. Using a 0.05 level of significance. a. Compute the sample proportion for each population. Round your answers to two decimal places. P1 = P₂ = P3 = b. Use the multiple comparison procedure to determine which population proportions differ significantly. Use a 0.05 level of significance. Round P₁, P₁, and absolute difference to two decimal places. Use Table 3 of Appendix B. 2 150 150 Significant if | Diff| > CV 3 Select your answer - - Select your answer - Select your answer - 95 105arrow_forwardYou may need to use the appropriate technology to answer this question. Use the sample data below to test the hypotheses Ho:P1 = P2 = P3 H3i not all population proportions are equal where p, is the population proportion of Yes responses for population i. Populations Response 1 3 Yes 140 150 106 No 90 150 114 Find the value of the test statistic. (Round your answer to three decimal places.) Find the p-value. (Round your answer to four decimal places.) p-value Using a 0.05 level of significance, state your conclusion. O Do not reject Ho. We conclude that not all population proportions are equal. Do not reject Ho: We cannot conclude that not all population proportions are equal. Reject Ho. We conclude that not all population proportions are equal. O Reject Ho: We cannot conclude that not all population proportions are equal.arrow_forward
arrow_back_ios
arrow_forward_ios
Recommended textbooks for you
 MATLAB: An Introduction with ApplicationsStatisticsISBN:9781119256830Author:Amos GilatPublisher:John Wiley & Sons Inc
 Probability and Statistics for Engineering and th...StatisticsISBN:9781305251809Author:Jay L. DevorePublisher:Cengage Learning
 Statistics for The Behavioral Sciences (MindTap C...StatisticsISBN:9781305504912Author:Frederick J Gravetter, Larry B. WallnauPublisher:Cengage Learning
 Elementary Statistics: Picturing the World (7th E...StatisticsISBN:9780134683416Author:Ron Larson, Betsy FarberPublisher:PEARSON
 The Basic Practice of StatisticsStatisticsISBN:9781319042578Author:David S. Moore, William I. Notz, Michael A. FlignerPublisher:W. H. Freeman
 Introduction to the Practice of StatisticsStatisticsISBN:9781319013387Author:David S. Moore, George P. McCabe, Bruce A. CraigPublisher:W. H. Freeman

MATLAB: An Introduction with Applications
Statistics
ISBN:9781119256830
Author:Amos Gilat
Publisher:John Wiley & Sons Inc

Probability and Statistics for Engineering and th...
Statistics
ISBN:9781305251809
Author:Jay L. Devore
Publisher:Cengage Learning

Statistics for The Behavioral Sciences (MindTap C...
Statistics
ISBN:9781305504912
Author:Frederick J Gravetter, Larry B. Wallnau
Publisher:Cengage Learning

Elementary Statistics: Picturing the World (7th E...
Statistics
ISBN:9780134683416
Author:Ron Larson, Betsy Farber
Publisher:PEARSON

The Basic Practice of Statistics
Statistics
ISBN:9781319042578
Author:David S. Moore, William I. Notz, Michael A. Fligner
Publisher:W. H. Freeman

Introduction to the Practice of Statistics
Statistics
ISBN:9781319013387
Author:David S. Moore, George P. McCabe, Bruce A. Craig
Publisher:W. H. Freeman