
MATLAB: An Introduction with Applications
6th Edition
ISBN: 9781119256830
Author: Amos Gilat
Publisher: John Wiley & Sons Inc
expand_more
expand_more
format_list_bulleted
Related questions
Concept explainers
Topic Video
Question

Transcribed Image Text:Safari
File
Edit
View
History
Bookmarks
Window
Help
Sun 10:16
A myopenmath.com
МyOpenMath
b Answered: What is a point estimate for the... | bartleby
b Answered: An engineer wishes to determine the... | bartleby
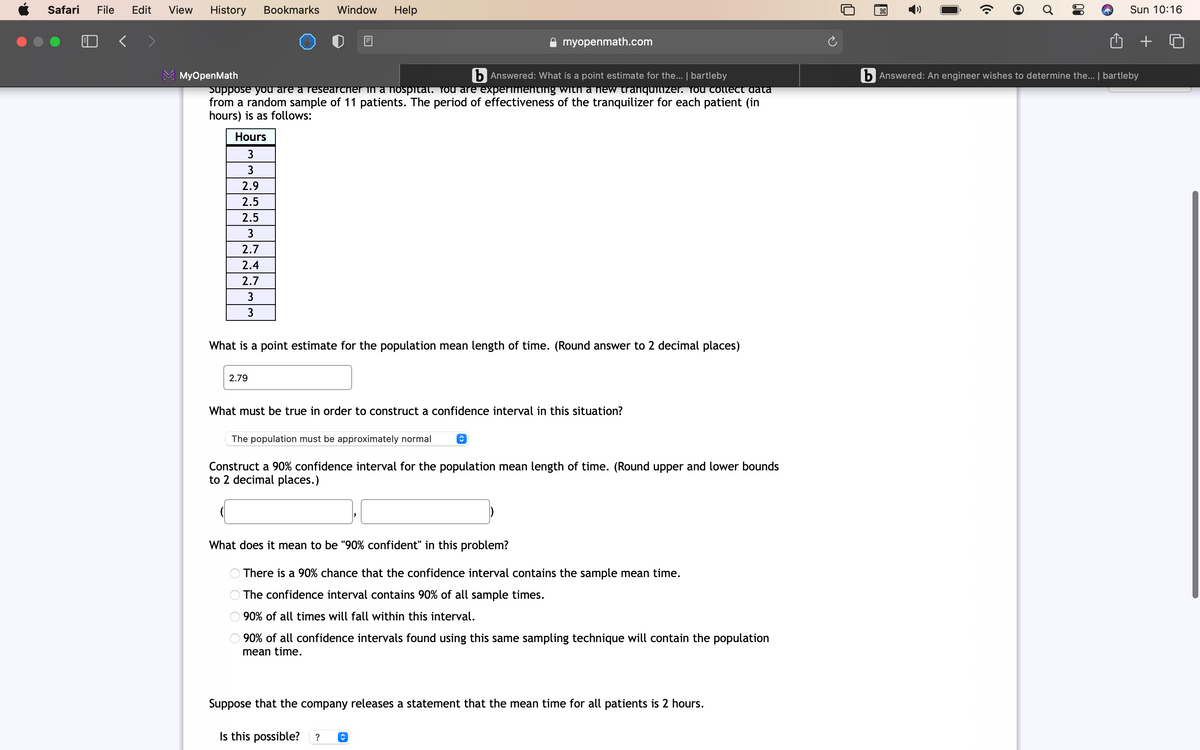
Suppose you are a researcher in a hospital. You are experimenting with a new tranqunizer. You collEtt data
from a random sample of 11 patients. The period of effectiveness of the tranquilizer for each patient (in
hours) is as follows:
Hours
3
3
2.9
2.5
2.5
3
2.7
2.4
2.7
3
3
What is a point estimate for the population mean length of time. (Round answer to 2 decimal places)
2.79
What must be true in order to construct a confidence interval in this situation?
The population must be approximately normal
Construct a 90% confidence interval for the population mean length of time. (Round upper and lower bounds
to 2 decimal places.)
What does it mean to be "90% confident" in this problem?
There is a 90% chance that the confidence interval contains the sample mean time.
The confidence interval contains 90% of all sample times.
90% of all times will fall within this interval.
O 90% of all confidence intervals found using this same sampling technique will contain the population
mean time.
Suppose that the company releases a statement that the mean time for all patients is 2 hours.
Is this possible?
Expert Solution
arrow_forward
Step 1
Given, the data from a random sample of n=11 patients regarding the period of effectiveness of tranquilizer for each patient.
The point estimate for the population mean length of time is obtained as-
In order to construct a confidence interval in this situation "The population must be approximately normal"
The required standard deviation for the sample is obtained as-
The degrees of freedom is obtained as-

Step by stepSolved in 3 steps

Knowledge Booster


Learn more about
Need a deep-dive on the concept behind this application? Look no further. Learn more about this topic, statistics and related others by exploring similar questions and additional content below.Similar questions
- Please determine the critical valuearrow_forward3..arrow_forwardThe length of fish were measured at 3 different lakes. Lake 1: 3.5, 4.2, 6.1, 5.2 Lake 2: 3.1, 3.2, 4.3, 2.1 Lake 3: 5.6, 7.1, 4.4, 4.1, 6.2 Is there evidence to suggest that the average length is not the same at all 3 locations? Group of answer choices There is not evidence to suggest the average length of fish is different at one of the lakes. There is evidence to suggest that the average length is different at one of the lakes. Enter the test statistic (to 4 decimal places)arrow_forward
- Save Exercise 11.07 Algo (Inferences About a Population Variance) In 2017, Americans spent a record-high $9.1 billion on Halloween-related purchases (the balance website). Sample data she adults spent on a Halloween costume are as follows. 14 66 23 64 36 39 30 42 53 16 16 99 42 35 65 26 a. What is the estimate of the population mean amount adults spend on a Halloween costume (to 2 decimals)? 24 b. What is the sample standard deviation (to 2 decimals)? 24 c. Provide a 95% confidence interval estimate of the population standard deviation for the amount adults spend on a Hallowe Table 11.1. 24 0= Icon Key Exercise 11.07 Algo (Inferences About a Population Variance) Savearrow_forwardWhat is the inter-quartile range of pH values. (choose the closest answer)? ph 5.8 5.7 5.6 5.5 5.4 5.3 5.2 5.1 5.0 4.7 4.6 4.5 4.4 4.3 4.2 4.1 A. 0.5 B. 4.9 C. 0.6 D. 4.3 E. 1.6 Boxplot of ph Iarrow_forwardA manufacturer of exercise equipment wanted to collect data on the effectiveness of their equipment. A magazine article compared how long it would take men and women to burn 200 calories during light or heavy workouts on various kinds of exercise equipment. The results summarized in the accompanying table are the average times for a group of physically active young men and women whose performances were measured on a representative sample of exercise equipment. Assume normality of the population. Complete parts (a) through (c) below. Click the icon to view the data table. C a) On average, how many minutes longer than a man must a woman exercise at a light exertion rate in order to burn 200 calories? Find a 95% confidence interval. minutes (Round to one decimal place as needed.) b) Estimate the average number of minutes longer a woman must work out at a light exertion than at heavy exertion to get the same benefit. Find a 95% confidence interval. (₁) minutes (Round to one decimal place…arrow_forward
- Pls do stepwise and correctly plsarrow_forwardFind the three measures of central tendency (the mean, median, and mode). (If an anewer does not exist, enter DNE.) 0, 1, 1, 2, 3, 4, 12, 33 mean median mode Need Help? Read R Additional Materialsarrow_forwardSuppose you are a researcher in a hospital. You are experimenting with a new tranquilizer. You collect data from a random sample of 11 patients. The period of effectiveness of the tranquilizer for each patient (in hours) is as follows: 2.8 2.6 2.2 2.1 2.6 2.7 3 2.3 2.3 a. What is a point estimate for the population mean length of time. (Round answer to 4 decimal places) b. Which distribution should you use for this problem? O normal distribution O-distribution c. Why? d. What must be true in order to construct a confidence interval in this situation? O The population mean must be known O The population standard deviation must be known O The population must be approximately normal O The sample size must be greater than 30 e. Construct a 99% confidence interval for the population mean length of tim Enter your answer as an open-interval (i.e., parentheses) Round upper and lower bounds to two decimal places f. Interpret the confidence interval in a complete sentence. Make sure you include…arrow_forward
- Recall the histogram of annual maximum wind speed. Frequency оооооо 25 to 30 30 to <35 35 to 40 A histogram with a single peak is unimodal. A histogram with two peaks is bimodal. A histogram with more than two peaks is multimodal. Look over the histogram again and notice the number of peaks, or modes, in the distribution. Indicate below the class interval(s) where a peak occurs. (Select all that apply.) 40 to 45 45 to < 50 50 to < 55 55 to < 60 14 12 10 60 to < 65 co 4 25 30 35 40 45 50 55 60 65 annual maximum wind speedarrow_forwardFor scenarios of statistical studies are given below. Decide which study uses a population parameter. And estimated 15% of Americans don't use the Internet. Lakeside family dentistry reported that six of the 15 patients who came in for regular cleaning one day had at least one cavity.arrow_forwardThe median for this question.arrow_forward
arrow_back_ios
SEE MORE QUESTIONS
arrow_forward_ios
Recommended textbooks for you
- MATLAB: An Introduction with ApplicationsStatisticsISBN:9781119256830Author:Amos GilatPublisher:John Wiley & Sons Inc
 Probability and Statistics for Engineering and th...StatisticsISBN:9781305251809Author:Jay L. DevorePublisher:Cengage Learning
 Statistics for The Behavioral Sciences (MindTap C...StatisticsISBN:9781305504912Author:Frederick J Gravetter, Larry B. WallnauPublisher:Cengage Learning
  Elementary Statistics: Picturing the World (7th E...StatisticsISBN:9780134683416Author:Ron Larson, Betsy FarberPublisher:PEARSON
 The Basic Practice of StatisticsStatisticsISBN:9781319042578Author:David S. Moore, William I. Notz, Michael A. FlignerPublisher:W. H. Freeman
 Introduction to the Practice of StatisticsStatisticsISBN:9781319013387Author:David S. Moore, George P. McCabe, Bruce A. CraigPublisher:W. H. Freeman
MATLAB: An Introduction with Applications
Statistics
ISBN:9781119256830
Author:Amos Gilat
Publisher:John Wiley & Sons Inc
Probability and Statistics for Engineering and th...
Statistics
ISBN:9781305251809
Author:Jay L. Devore
Publisher:Cengage Learning
Statistics for The Behavioral Sciences (MindTap C...
Statistics
ISBN:9781305504912
Author:Frederick J Gravetter, Larry B. Wallnau
Publisher:Cengage Learning
Elementary Statistics: Picturing the World (7th E...
Statistics
ISBN:9780134683416
Author:Ron Larson, Betsy Farber
Publisher:PEARSON
The Basic Practice of Statistics
Statistics
ISBN:9781319042578
Author:David S. Moore, William I. Notz, Michael A. Fligner
Publisher:W. H. Freeman
Introduction to the Practice of Statistics
Statistics
ISBN:9781319013387
Author:David S. Moore, George P. McCabe, Bruce A. Craig
Publisher:W. H. Freeman