
MATLAB: An Introduction with Applications
6th Edition
ISBN: 9781119256830
Author: Amos Gilat
Publisher: John Wiley & Sons Inc
expand_more
expand_more
format_list_bulleted
Related questions
Question
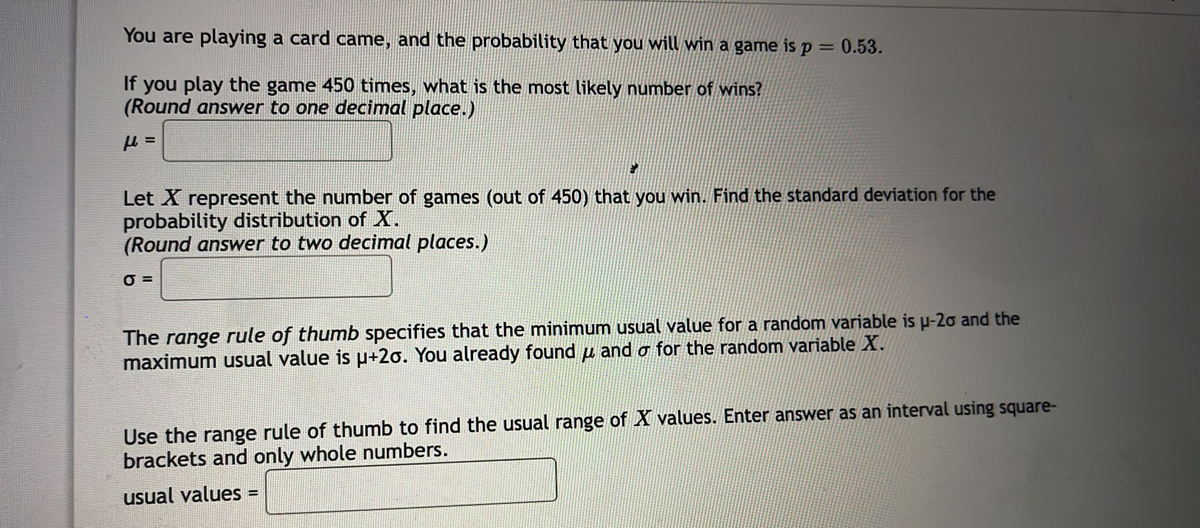

Transcribed Image Text:You are playing a card came, and the probability that you will win a game is p = 0.53.
If you play the game 450 times, what is the most likely number of wins?
(Round answer to one decimal place.)
Let X represent the number of games (out of 450) that you win. Find the standard deviation for the
probability distribution of X.
(Round answer to two decimal places.)
O =
The range rule of thumb specifies that the minimum usual value for a random variable is u-20 and the
maximum usual value is u+2o. You already found u and o for the random variable X.
Use the range rule of thumb to find the usual range of X values. Enter answer as an interval using square-
brackets and only whole numbers.
usual values =
Expert Solution
This question has been solved!
Explore an expertly crafted, step-by-step solution for a thorough understanding of key concepts.

This is a popular solution

Trending nowThis is a popular solution!

Step by stepSolved in 4 steps

Knowledge Booster

Similar questions
- Five males with an X-linked genetic disorder have one child each. The random variable x is the number of children among the five who inherit the X-linked genetic disorder. Determine whether a probability distribution is given. If a probability distribution is given, find its mean and standard deviation. If a probability distribution is not given, identify the requirements that are not satisfied. child(ren) (Round to one decimal place as needed.) X 0 1 2 3 4 5 Does the table show a probability distribution? Select all that apply. A. Yes, the table shows a probability distribution. B. No, the random variable x's number values are not associated with probabilities. C. No, the random variable x is categorical instead of numerical. D. No, not every probability is between 0 and 1 inclusive. E. No, the sum of all the probabilities is not equal to 1. Find the mean of the random variable x. Select the correct choice below and, if necessary, fill in the answer box to complete your choice. P(x)…arrow_forwardLet the random variable X represent the number of heads when a coin is tossed 4 times. The fallowing table describes the probability distribution of the random variable X: x P(x) 0 0.0625 1 0.25 2 0.375 3 0.25 4 0.0625 What is the probability of getting at least 2 heads? Round your answer to 4 decimals. Enter Answer:arrow_forwardCollege students are randomly selected and arranged in groups of three. The random variable x is the number in the group who say that they take one or more online courses. Determine whether a probability distribution is given. If a probability distribution is given, find its mean and standard deviation. If a probability distribution is not given, identify the requirements that are not satisfied. Does the table show a probability distribution? Select all that apply. A. Yes, the table shows a probability distribution. B. No, the sum of all the probabilities is not equal to 1. C. No, the random variable x is categorical instead of numerical. D. No, the numerical values of the random variable x are not associated with probabilities. E. No, not every probability is between 0 and 1 inclusive. Find the mean of the random variable x. Select the correct choice below and, if necessary, fill in the answer box to complete your choice. OA. H= students (Round to one decimal place as needed.) O B.…arrow_forward
- The probabilities and the number of automobiles lined up at the Ford dealership at opening time (8:00AM) for service are: Number Probability 1 0.05 0.30 0.40 4 0.25 Calculate the standard deviation of the probability distribution above. Express your answer rounded to 2 decimal places. Your Answer: Answer units N 3arrow_forwardFind the probability and interpret the results. If convenient, use technology to find the probability. The population mean annual salary for environmental compliance specialists is about $60,500. A random sample of 35 specialists is drawn from this population. What is the probability that the mean salary of the sample is less than $57,500? Assume o = $6,100. %3D The probability that the mean salary of the sample is less than $57,500 is (Round to four decimal places as needed.)arrow_forwardVerify whether the given table represents a probability distribution. In those cases where a probability distribution is described, find the mean and standard deviation. NOTE: The Rounding Rule for the mean and standard deviation: They should be rounded to one more decimal place than occurs in the raw data. For a group of four students, the number y who takes the Calculus II class next semester is given by this table. y P(y) 0 0.5131 1 0.3139 2 0.0624 3 0.1102 4 0.2002 Probability distribution with μ=0.4 and σ=0.4 Probability distribution with μ=0.6 and σ=0.1 Probability distribution with μ=0.6 and σ=0.3 Probability distribution with μ=0.7 and σ=0.4arrow_forward
- The average amount of snow per season in Trafford is 45 inches. The standard deviation is 5 inches. Use a graphing calculator to find the probability that next year Trafford will receive the given amount of snowfall. Assume the random variable is normally distributed. Round your answers to 3 decimal places. Part: 0/2 Part 1 of 2 (a) Find the probability Trafford will receive at most 54 inches of snow. The probability that Trafford will receive at most 54 inches of snow is Xarrow_forwardA customer service center is tracking number of complaints in each week. Let X be the number of complaints in each week. The probability distribution of X is summarized as below. X 0 1 2 3 Probability 0.4 ? 0.15 0.05 Can we be certain that the standard deviation of X is less than 3?arrow_forwardCollege students are randomly selected and arranged in groups of three. The random variable x is the number in the group who say that they take one or more online courses. Determine whether a probability distribution is given. If a probability distribution is given, find its mean and standard deviation. If a probability distribution is not given, identify the requirements that are not satisfied. Does the table show a probability distribution? Select all that apply. A. Yes, the table shows a probability distribution. B. No, the numerical values of the random variable x are not associated with probabilities. C. No, the random variable x is categorical instead of numerical. D. No, the sum of all the probabilities is not equal to 1. E. No, not every probability is between 0 and 1 inclusive. Find the mean of the random variable x. Select the correct choice below and, if necessary, fill in the answer box to complete your choice. O A. μ= students (Round to one decimal place as needed.) OB.…arrow_forward
arrow_back_ios
arrow_forward_ios
Recommended textbooks for you
- MATLAB: An Introduction with ApplicationsStatisticsISBN:9781119256830Author:Amos GilatPublisher:John Wiley & Sons Inc
 Probability and Statistics for Engineering and th...StatisticsISBN:9781305251809Author:Jay L. DevorePublisher:Cengage Learning
 Statistics for The Behavioral Sciences (MindTap C...StatisticsISBN:9781305504912Author:Frederick J Gravetter, Larry B. WallnauPublisher:Cengage Learning
  Elementary Statistics: Picturing the World (7th E...StatisticsISBN:9780134683416Author:Ron Larson, Betsy FarberPublisher:PEARSON
 The Basic Practice of StatisticsStatisticsISBN:9781319042578Author:David S. Moore, William I. Notz, Michael A. FlignerPublisher:W. H. Freeman
 Introduction to the Practice of StatisticsStatisticsISBN:9781319013387Author:David S. Moore, George P. McCabe, Bruce A. CraigPublisher:W. H. Freeman
MATLAB: An Introduction with Applications
Statistics
ISBN:9781119256830
Author:Amos Gilat
Publisher:John Wiley & Sons Inc
Probability and Statistics for Engineering and th...
Statistics
ISBN:9781305251809
Author:Jay L. Devore
Publisher:Cengage Learning
Statistics for The Behavioral Sciences (MindTap C...
Statistics
ISBN:9781305504912
Author:Frederick J Gravetter, Larry B. Wallnau
Publisher:Cengage Learning
Elementary Statistics: Picturing the World (7th E...
Statistics
ISBN:9780134683416
Author:Ron Larson, Betsy Farber
Publisher:PEARSON
The Basic Practice of Statistics
Statistics
ISBN:9781319042578
Author:David S. Moore, William I. Notz, Michael A. Fligner
Publisher:W. H. Freeman
Introduction to the Practice of Statistics
Statistics
ISBN:9781319013387
Author:David S. Moore, George P. McCabe, Bruce A. Craig
Publisher:W. H. Freeman