
MATLAB: An Introduction with Applications
6th Edition
ISBN: 9781119256830
Author: Amos Gilat
Publisher: John Wiley & Sons Inc
expand_more
expand_more
format_list_bulleted
Related questions
Question
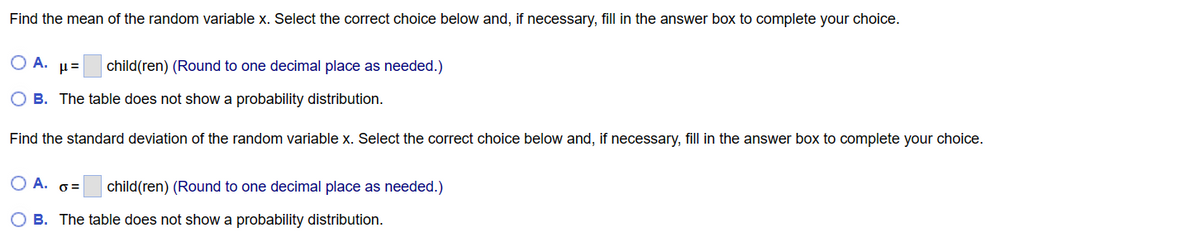

Transcribed Image Text:Find the mean of the random variable x. Select the correct choice below and, if necessary, fill in the answer box to complete your choice.
O A.
μ= child(ren) (Round to one decimal place as needed.)
OB. The table does not show a probability distribution.
Find the standard deviation of the random variable x. Select the correct choice below and, if necessary, fill in the answer box to complete your choice.
O A. o=
child(ren) (Round to one decimal place as needed.)
OB. The table does not show a probability distribution.

Transcribed Image Text:Five males with an X-linked genetic disorder have one child each. The
random variable x is the number of children among the five who inherit
the X-linked genetic disorder. Determine whether a probability distribution
is given. If a probability distribution is given, find its mean and standard
deviation. If a probability distribution is not given, identify the requirements
that are not satisfied.
Does the table show a probability distribution? Select all that apply.
X
0
1
2
3
4
5
P(x)
0.027
0.148
0.325
0.325
0.148
0.027
A. Yes, the table shows a probability distribution.
B. No, not every probability is between 0 and 1 inclusive.
C. No, the sum of all the probabilities is not equal to 1.
D. No, the random variable x's number values are not associated with probabilities.
E. No, the random variable x is categorical instead of numerical.
Expert Solution
This question has been solved!
Explore an expertly crafted, step-by-step solution for a thorough understanding of key concepts.

This is a popular solution

Trending nowThis is a popular solution!

Step by stepSolved in 4 steps with 7 images

Knowledge Booster

Similar questions
- Answer and solve 1-4, show all work and calculator work.arrow_forwardFive males with an X-linked genetic disorder have one child each. The random variable x is the number of children among the five who inherit the X-linked genetic disorder. Determine whether a probability distribution is given. If a probability distribution is given, find its mean and standard deviation. If a probability distribution is not given, identify the requirements that are not satisfied. Does the table show a probability distribution? Select all that apply. X 0 1 2 3 4 5 child(ren) (Round to one decimal place as needed.) P(x) 0.027 0.152 0.321 0.321 0.152 0.027 A. Yes, the table shows a probability distribution. B. No, the random variable x is categorical instead of numerical. C. No, not every probability is between 0 and 1 inclusive. D. No, the sum of all the probabilities is not equal to 1. E. No, the random variable x's number values are not associated with probabilities. Find the mean of the random variable x. Select the correct choice below and, if necessary, fill in the…arrow_forwardSolve using R. Show all work.arrow_forward
- Five males with an X-linked genetic disorder have one child each. The random variable x is the number of children among the five who inherit the X-linked genetic disorder. Determine whether a probability distribution is given. If a probability distribution is given, find its mean and standard deviation. If a probability distribution is not given, identify the requirements that are not satisfied. X 0 1 K 2 3 4 5 P(x) 0.026 0.162 0.312 0.312 0.162 0.026 Does the table show a probability distribution? Select all that apply. A. Yes, the table shows a probability distribution. B. No, the random variable x's number values are not associated with probabilities. C. No, not every probability is between 0 and 1 inclusive. D. No, the random variable x is categorical instead of numerical. E. No, the sum of all the probabilities is not equal to 1.arrow_forwardFive males with an X-linked genetic disorder have one child each. The random variable x is the number of children among the five who inherit the X-linked genetic disorder. Determine whether a probability distribution is given. If a probability distribution is given, find its mean and standard deviation. If a probability distribution is not given, identify the requirements that are not satisfied. Does the table show a probability distribution? Select all that apply. X 0 1 2 3 4 5 P(x) O 0.032 0.147 0.321 0.321 0.147 0.032 A. Yes, the table shows a probability distribution. B. No, the sum of all the probabilities is not equal to 1. C. No, the random variable x is categorical instead of numerical. D. No, the random variable x's number values are not associated with probabilities. E. No, not every probability is between 0 and 1 inclusive.arrow_forwardFind the probability. Suppose x is a random variable best described by a uniform probability distribution with c= 10 and d=50. Find P(x>50). C= 0.4 0.5 1 Oarrow_forward
- Find the probability of the indicated event if P(E) = 0.25 and P(F) = 0.35. Find P(E or F) if P(E and F)= 0.20. P(E or F) =| (Simplify your answer.)arrow_forward2) Consider each distribution. Determine if it is a valid probability distribution or not and explain your answer. b, 2. 1. 2. P(x) 0.25 0.60 0.15 P(x) 0.25 0,60 0,20arrow_forwardFive males with an X-linked genetic disorder have one child each. The random variable x is the number of children among the five who inherit the X-linked genetic disorder. Determine whether a probability distribution is given. If a probability distribution is given, find its mean and standard deviation. If a probability distribution is not given, identify the requirements that are not satisfied. child(ren) (Round to one decimal place as needed.) X 0 1 2 3 4 5 Does the table show a probability distribution? Select all that apply. A. Yes, the table shows a probability distribution. B. No, the random variable x's number values are not associated with probabilities. C. No, the random variable x is categorical instead of numerical. D. No, not every probability is between 0 and 1 inclusive. E. No, the sum of all the probabilities is not equal to 1. Find the mean of the random variable x. Select the correct choice below and, if necessary, fill in the answer box to complete your choice. P(x)…arrow_forward
- Let the random variable X represent the number of heads when a coin is tossed 4 times. The fallowing table describes the probability distribution of the random variable X: x P(x) 0 0.0625 1 0.25 2 0.375 3 0.25 4 0.0625 What is the probability of getting at least 2 heads? Round your answer to 4 decimals. Enter Answer:arrow_forwardPls answer number 1 and 2arrow_forwardneed hekp with this, please!arrow_forward
arrow_back_ios
SEE MORE QUESTIONS
arrow_forward_ios
Recommended textbooks for you
- MATLAB: An Introduction with ApplicationsStatisticsISBN:9781119256830Author:Amos GilatPublisher:John Wiley & Sons Inc
 Probability and Statistics for Engineering and th...StatisticsISBN:9781305251809Author:Jay L. DevorePublisher:Cengage Learning
 Statistics for The Behavioral Sciences (MindTap C...StatisticsISBN:9781305504912Author:Frederick J Gravetter, Larry B. WallnauPublisher:Cengage Learning
  Elementary Statistics: Picturing the World (7th E...StatisticsISBN:9780134683416Author:Ron Larson, Betsy FarberPublisher:PEARSON
 The Basic Practice of StatisticsStatisticsISBN:9781319042578Author:David S. Moore, William I. Notz, Michael A. FlignerPublisher:W. H. Freeman
 Introduction to the Practice of StatisticsStatisticsISBN:9781319013387Author:David S. Moore, George P. McCabe, Bruce A. CraigPublisher:W. H. Freeman
MATLAB: An Introduction with Applications
Statistics
ISBN:9781119256830
Author:Amos Gilat
Publisher:John Wiley & Sons Inc
Probability and Statistics for Engineering and th...
Statistics
ISBN:9781305251809
Author:Jay L. Devore
Publisher:Cengage Learning
Statistics for The Behavioral Sciences (MindTap C...
Statistics
ISBN:9781305504912
Author:Frederick J Gravetter, Larry B. Wallnau
Publisher:Cengage Learning
Elementary Statistics: Picturing the World (7th E...
Statistics
ISBN:9780134683416
Author:Ron Larson, Betsy Farber
Publisher:PEARSON
The Basic Practice of Statistics
Statistics
ISBN:9781319042578
Author:David S. Moore, William I. Notz, Michael A. Fligner
Publisher:W. H. Freeman
Introduction to the Practice of Statistics
Statistics
ISBN:9781319013387
Author:David S. Moore, George P. McCabe, Bruce A. Craig
Publisher:W. H. Freeman