
MATLAB: An Introduction with Applications
6th Edition
ISBN: 9781119256830
Author: Amos Gilat
Publisher: John Wiley & Sons Inc
expand_more
expand_more
format_list_bulleted
Related questions
Question
The standard error for is equal to 0.113. The test statistic for the hypothesis test specified in question 9 is equal to:
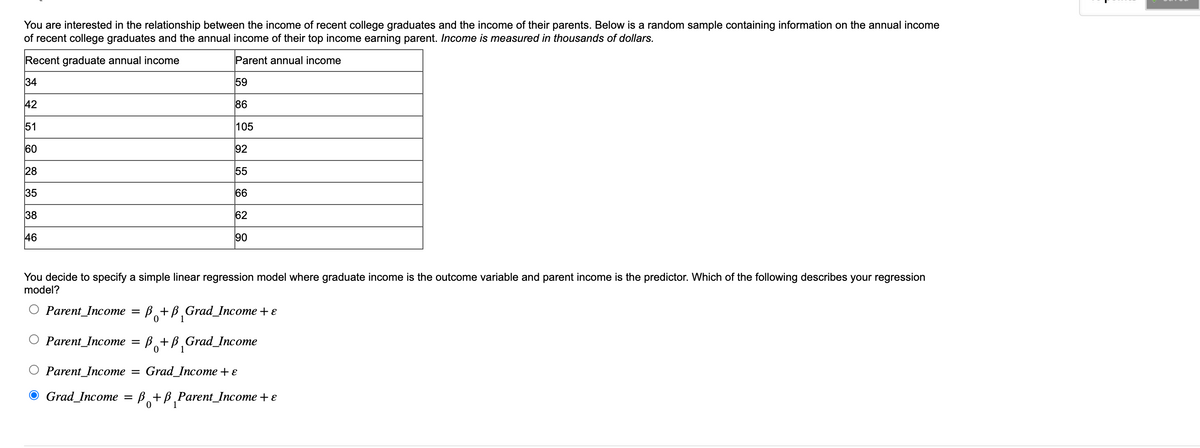

Transcribed Image Text:You are interested in the relationship between the income of recent college graduates and the income of their parents. Below is a random sample containing information on the annual income
of recent college graduates and the annual income of their top income earning parent. Income is measured in thousands of dollars.
Recent graduate annual income
Parent annual income
34
42
5823
51
60
38
46
Parent Income =
59
86
105
92
55
66
62
You decide to specify a simple linear regression model where graduate income is the outcome variable and parent income is the predictor. Which of the following describes your regression
model?
Parent_Income =
90
B+B Grad_Income + e
0 1
B+B Grad_Income
0 1
Parent_Income = Grad Income + ε
O Grad_Income P+P Parent_Income + ε
0

Transcribed Image Text:Test the hypothesis that there is a linear relationship between parent income and recent graduate income. Which of the following is the correct statement of the hypotheses?
O Ho: P 0
0
0
Ha: B
Ho: P
Ha: B
0
0
0
● Ho: P₁
-
0
= 0
= 0
Ha: B, 0
1
Ho: p₁ <0
1
Ha: B, > 0
1
Expert Solution
This question has been solved!
Explore an expertly crafted, step-by-step solution for a thorough understanding of key concepts.

Step by stepSolved in 4 steps with 12 images

Knowledge Booster

Similar questions
- Perform the test of hypothesis on the following scenarios. A brand of powdered milk is advertised as having a net weight of 250 grams. A curious consumer obtained the net weight of 10 randomly selected cans. The values obtained are 256, 248, 242, 245, 246, 248, 250, 255, 243, and 249 grams. Is there reason to believe that the average net weight of the powdered milk cans is less than 250 grams at 10% level of significance? Assume the net weight is normally distributed with unknown population variance. Note: pls follow the given steps in the photo attachedarrow_forwardUse the six steps of hypothesis testing to answer the following question. Remember to determine if the problem is a Z test or T test as that will influence your critical value. You work at a cereal plant and believe the machines are under filling the boxes. All boxes should contain 20 ounces of cereal. You draw a sample of 70 boxes and find an average of 18.6 ounces with a standard deviation of 2.8. Are the boxes being under filled?arrow_forwardA two-proportions z-test is to be performed using the P-value approach. Use the given sample data to find the P-value for the hypothesis test. x₁ = 11, n₁ =200, x₂ = 8, n₂ = 100; Ho: P₁ = P₂, H₂: P₁ P₂, α=0.01 O A. 0.1011 B. 0.3844 C. 0.4010 O D. 0.2005arrow_forward
- Consider the hypothesis test below. Ho P1 Ha P₁ The following results are for independent samples taken from the two populations. Sample 1 n1 = 100 P₁ = 0.28 P2 ≤ 0 P20 Use pooled estimator of p. a. What is the p-value (to 4 decimals)? Use Table 1 from Appendix B. 0 Sample 2 7₂ = 300 P2 = 0.15arrow_forwardSuppose that in a random selection of 100 colored candies, 25% of them are blue. The candy company claims that the percentage of blue candies is equal to 26%. Use a 0.01 significance level to test that claim. Identify the null and alternative hypotheses for this test. Choose the correct answer below. O A. Ho: p=0.26 H₁: p0.26 O C. Ho: p=0.26 H₁: p=0.26 O D. Ho: p=0.26 H₁: p=0.26 Identify the test statistic for this hypothesis test. The test statistic for this hypothesis test is (Round to two decimal places as needed.) Identify the P-value for this hypothesis test. The P-value for this hypothesis test is (Round to three decimal places as needed.) Identify the conclusion for this hypothesis test. O A. Reject Ho. There is sufficient evidence to warrant rejection of the claim that the percentage of blue candies is equal to 26% B. Reject Ho. There is not sufficient evidence to warrant rejection of the claim that the percentage of blue candies is equal to 26% C. Fail to reject Hỏ. There is…arrow_forwardConsider the following hypothesis test. H0: ? = 100 Ha: ? ≠ 100 A sample of 65 is used. Identify the p-value and state your conclusion for each of the following sample results. Use ? = 0.05. (a) x = 104 and s = 11.5 Find the value of the test statistic. (Round your answer to three decimal places.) Find the p-value. (Round your answer to four decimal places.) State your conclusion. Reject H0. There is sufficient evidence to conclude that ? ≠ 100.Do not reject H0. There is insufficient evidence to conclude that ? ≠ 100. Do not reject H0. There is sufficient evidence to conclude that ? ≠ 100.Reject H0. There is insufficient evidence to conclude that ? ≠ 100. (b) x = 96.5 and s = 11.0 Find the value of the test statistic. (Round your answer to three decimal places.) Find the p-value. (Round your answer to four decimal places.) p-value = State your conclusion. Reject H0. There is sufficient evidence to conclude that ? ≠ 100.Do not reject H0. There is insufficient…arrow_forward
- The one-sample ?‑statistic for a test of ?0:?=0 versus ?1:?≠0 based on ?=15 observations has the value ?=−2.138, where ?0 and ?1 are the null and alternative hypotheses, respectively. The sample size is denoted by ?. Use this ?‑table to determine which two ?-values bracket the ?-value of the test. Report your answer as listed in the given ?‑table.arrow_forwardquestions : "determine the null and alternative hypotheses" and the pnes below it.arrow_forwardSuppose that in a random selection of 100 colored candies, 20% of them are blue. The candy company claims that the percentage of blue candies is equal to 26%. Use a 0.01 significance level to test that claim. Identify the null and alternative hypotheses for this test. Choose the correct answer below. O A. Ho: p +0.26 H₁: p=0.26 O B. Ho: p=0.26 H₁: p=0.26 O C. Ho: p = 0.26 H₁: p>0.26 O D. Ho: p=0.26 H₁: p<0.26arrow_forward
- The p-value for a hypothesis test turns out to be 0.00694. At a 9% level of significance, what is the proper decision? Reject H0H0 Fail to reject H0arrow_forwardSuppose that in a random selection of 100 colored candies, 22% of them are blue. The candy company claims that the percentage of blue candies is equal to 30%. Use a 0.10 significance level to test that claim. Identify the null and alternative hypotheses for this test. Choose the correct answer below. O A. Ho: p=0.3 H₁: p=0.3 O B. Ho: p=0.3 H₁: p=0.3 C. Ho: p=0.3 H₁: p>0.3 O D. Ho: p=0.3 H₁: p<0.3 Identify the test statistic for this hypothesis test. The test statistic for this hypothesis test is (Round to two decimal places as needed.) Identify the P-value for this hypothesis test. The P-value for this hypothesis test is (Round to three decimal places as needed.) Identify the conclusion for this hypothesis test. A. Reject Ho. There is sufficient evidence to warrant rejection of the claim that the percentage of blue candies is equal to 30% B. Reject Ho. There is not sufficient evidence to warrant rejection of the claim that the percentage of blue candies is equal to 30% O C. Fail to…arrow_forwardThe p-value for a hypothesis test turns out to be 0.00857. At a 8% level of significance, what is the proper decision? Reject H0H0 Fail to reject H0arrow_forward
arrow_back_ios
SEE MORE QUESTIONS
arrow_forward_ios
Recommended textbooks for you
- MATLAB: An Introduction with ApplicationsStatisticsISBN:9781119256830Author:Amos GilatPublisher:John Wiley & Sons Inc
 Probability and Statistics for Engineering and th...StatisticsISBN:9781305251809Author:Jay L. DevorePublisher:Cengage Learning
 Statistics for The Behavioral Sciences (MindTap C...StatisticsISBN:9781305504912Author:Frederick J Gravetter, Larry B. WallnauPublisher:Cengage Learning
  Elementary Statistics: Picturing the World (7th E...StatisticsISBN:9780134683416Author:Ron Larson, Betsy FarberPublisher:PEARSON
 The Basic Practice of StatisticsStatisticsISBN:9781319042578Author:David S. Moore, William I. Notz, Michael A. FlignerPublisher:W. H. Freeman
 Introduction to the Practice of StatisticsStatisticsISBN:9781319013387Author:David S. Moore, George P. McCabe, Bruce A. CraigPublisher:W. H. Freeman
MATLAB: An Introduction with Applications
Statistics
ISBN:9781119256830
Author:Amos Gilat
Publisher:John Wiley & Sons Inc
Probability and Statistics for Engineering and th...
Statistics
ISBN:9781305251809
Author:Jay L. Devore
Publisher:Cengage Learning
Statistics for The Behavioral Sciences (MindTap C...
Statistics
ISBN:9781305504912
Author:Frederick J Gravetter, Larry B. Wallnau
Publisher:Cengage Learning
Elementary Statistics: Picturing the World (7th E...
Statistics
ISBN:9780134683416
Author:Ron Larson, Betsy Farber
Publisher:PEARSON
The Basic Practice of Statistics
Statistics
ISBN:9781319042578
Author:David S. Moore, William I. Notz, Michael A. Fligner
Publisher:W. H. Freeman
Introduction to the Practice of Statistics
Statistics
ISBN:9781319013387
Author:David S. Moore, George P. McCabe, Bruce A. Craig
Publisher:W. H. Freeman