
MATLAB: An Introduction with Applications
6th Edition
ISBN: 9781119256830
Author: Amos Gilat
Publisher: John Wiley & Sons Inc
expand_more
expand_more
format_list_bulleted
Related questions
Concept explainers
Question
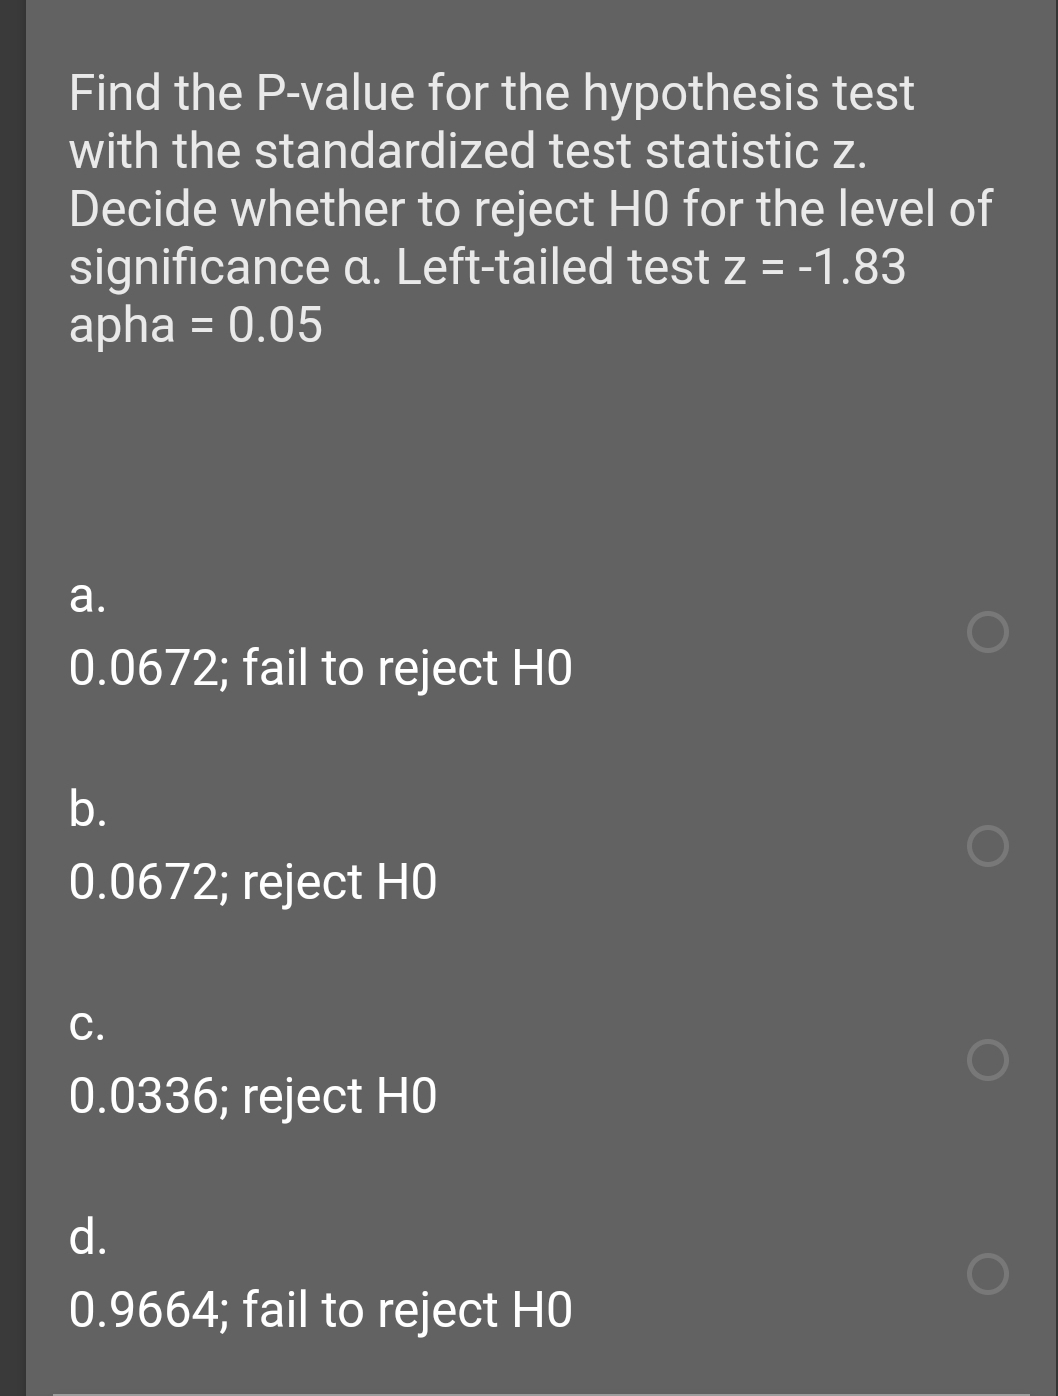

Transcribed Image Text:Find the P-value for the hypothesis test
with the standardized test statistic z.
Decide whether to reject HO for the level of
significance a. Left-tailed test z = -1.83
apha = 0.05
a.
0.0672; fail to reject HO
b.
0.0672; reject HO
C.
0.0336; reject но
d.
0.9664; fail to reject HO
Expert Solution
This question has been solved!
Explore an expertly crafted, step-by-step solution for a thorough understanding of key concepts.

This is a popular solution

Trending nowThis is a popular solution!

Step by stepSolved in 2 steps with 2 images

Knowledge Booster


Learn more about
Need a deep-dive on the concept behind this application? Look no further. Learn more about this topic, statistics and related others by exploring similar questions and additional content below.Similar questions
- I only need Answers of 9, 10, 11, 12, 13, 14, 15, 16arrow_forwardapply. Question 2 – hypothesis test with guidance ample of 14 account balances of a credit company showed a mean customer balance of U, but the marketing manager claimed that the mean balance for the population was Z5. The marketing manager did NOT have the population standard deviation, but the sample standard deviation was found to be $500. Use the p-value approach to conduct a full nypothesis test (all steps) that can be used to determine whether the mean of all account balances is significantly different from $4,325. Let a = .10.arrow_forwardUse technology and the StudentSurvey dataset to test whether the data provide evidence that there is a difference in the mean number of hours spent watching television per week between males and females. Click here for the dataset associated with this question. What are the hypotheses? Use subscripts 1 for females and 2 for males. :: u :: p :: Pi : P2 :: p :: x :: x1 :: = :: :: U2 :: x2 : p : P1 : P2 :: r Ho: ! I vs Ha: 1 ::arrow_forward
- Can you tell me what the solution would be to this one?arrow_forwardPlease explainarrow_forwardTotal blood volume (in ml) per body weight (in kg) is important in medical research. For healthy adults, the red blood cell volume mean is about µ = 28 ml/kg with a standard deviation of 4.75ml/kg. Red blood cells volume that is too low or too high can indicate a medical problem. Suppose he does a hypothesis test with a significance level of 0.01. Roger has had seven blood tests and the red blood cell volumes were: 32 25 41 35 30 37 29 Roger’s null hypothesis is that his blood tests are normal and that his alternative hypothesis is that something is wrong. Symbolically, the null and hypotheses are as follows Ho: µ = 28 ml/kg and Hi: µ ≠ 28 ml/kg What value of the test statistic (z) should he report? (Sampling a Normal Distribution for the Mean µ) Group of answer choices a. 0.99 b.2.42 c.2.62 d.2.22arrow_forward
- select which of the three is correctarrow_forwardAn electrician wants to know whether batteries made by two manufacturers have significantly different voltages. The voltage of 131 batteries from each manufacturer were measured. The population standard deviations of the voltage for each manufacturer are known. The results are summarized in the following table. Manufacturer Sample mean voltage (millivolts) Population standard deviat A 116 3 115 4 What type of hypothesis test should be performed? Right-tailed z-test v What is the test statistic? Ex: 0.12 Does sufficient evidence exist to support the claim that the voltage of the batteries made by the two manufacturers is different at the a = 0.01 significance level? Select varrow_forwardA sample of 33 lights in Austin gives an average of 46 cars/min while the city SD=3.4 A sample of 34 Dallas lights give a mean of 44 cars/mim with the city SD=1.4 At the 91% level, do the towns differ? 1. Is the test (A-Left Tailed, B-Right Tailed, C-2-Tailed) (separate with comma if there are 2) 2. Critical Value 3. Test statistic 4. 3-decimal p-Valuearrow_forward
- Do men talk less than women? The table shows results from a study of the words spoken in a day by men and women. Assume that the two samples are randomly selected, independent, the population standard deviations are not know and not considered equal. At the 0.05 significance level, test the claim that the mean number of words spoken by men is less than the mean number of words spoken by women. Men Women n1 = 212 n2 = 218 xˉx̄1 = 15706.4 words xˉx̄2 = 15683.2 words s1 = 1595.44 words s2 = 1597.54 words What are the correct hypotheses? (Select the correct symbols and use decimal values not percentages.)H0: Select an answer μ₁ μ σ₁² x̄₂ p x̄₁ s₁² p̂₁ μ(men) p₂ p₁ μ₂ ? ≤ > ≥ = ≠ < Select an answer μ₁ p₁ μ₂ x̄₂ σ₁² p̂₁ μ s₁² μ(women) p x̄₁ p₂ H1: Select an answer p̂₂ p s₂² σ₂² μ(men) μ μ₂ x̄₂ x̄₁ p₂ μ₁ p₁ ? < > = ≠ ≥ ≤ Select an answer μ₂ μ p₂ s₁² p₁ x̄₁ σ₁² p̂₁ p μ₁ x̄₂ μ(women) Original Claim = Select an answer H₁ H₀ df = Based on the hypotheses, find the…arrow_forwardPLEASE ONLY SELECT THE ANSWERS AS SHOWN FOR THE MULTIPLE CHOICE, SUCH AS OPTION 1, 2, ETC. 1) In a test of the effectiveness of garlic for lowering cholesterol, 49 subjects were treated with raw garlic. Cholesterol levels were measured before and after the treatment. The changes (before minus after) in their levels of LDL cholesterol (in mg/dL) have a mean of 0.8 and a standard deviation of 1.51. Use a 0.10 significance level to test the claim that with garlic treatment, the mean change in LDL cholesterol is greater than 0. What do the results suggest about the effectiveness of the garlic treatment? Assume that a simple random sample has been selected. Identify the null and alternative hypotheses, test statistic, P-value, and state the final conclusion that addresses the original claim. What are the null and alternative hypotheses? A. H0: μ=0 mg/dL H1: μ<0 mg/dL B. H0: μ>0 mg/dL H1: μ<0 mg/dL C. H0: μ=0 mg/dL H1: μ≠0 mg/dL D. H0: μ=0 mg/dL H1: μ>0 mg/dL…arrow_forwardQ5. With 0.05 significance level, H1: p > 0.5, and the value of test statistic is z = 1.93. Then theP-value is equal to 0.9732.a. Trueb. Falsearrow_forward
arrow_back_ios
SEE MORE QUESTIONS
arrow_forward_ios
Recommended textbooks for you
- MATLAB: An Introduction with ApplicationsStatisticsISBN:9781119256830Author:Amos GilatPublisher:John Wiley & Sons Inc
 Probability and Statistics for Engineering and th...StatisticsISBN:9781305251809Author:Jay L. DevorePublisher:Cengage Learning
 Statistics for The Behavioral Sciences (MindTap C...StatisticsISBN:9781305504912Author:Frederick J Gravetter, Larry B. WallnauPublisher:Cengage Learning
  Elementary Statistics: Picturing the World (7th E...StatisticsISBN:9780134683416Author:Ron Larson, Betsy FarberPublisher:PEARSON
 The Basic Practice of StatisticsStatisticsISBN:9781319042578Author:David S. Moore, William I. Notz, Michael A. FlignerPublisher:W. H. Freeman
 Introduction to the Practice of StatisticsStatisticsISBN:9781319013387Author:David S. Moore, George P. McCabe, Bruce A. CraigPublisher:W. H. Freeman
MATLAB: An Introduction with Applications
Statistics
ISBN:9781119256830
Author:Amos Gilat
Publisher:John Wiley & Sons Inc
Probability and Statistics for Engineering and th...
Statistics
ISBN:9781305251809
Author:Jay L. Devore
Publisher:Cengage Learning
Statistics for The Behavioral Sciences (MindTap C...
Statistics
ISBN:9781305504912
Author:Frederick J Gravetter, Larry B. Wallnau
Publisher:Cengage Learning
Elementary Statistics: Picturing the World (7th E...
Statistics
ISBN:9780134683416
Author:Ron Larson, Betsy Farber
Publisher:PEARSON
The Basic Practice of Statistics
Statistics
ISBN:9781319042578
Author:David S. Moore, William I. Notz, Michael A. Fligner
Publisher:W. H. Freeman
Introduction to the Practice of Statistics
Statistics
ISBN:9781319013387
Author:David S. Moore, George P. McCabe, Bruce A. Craig
Publisher:W. H. Freeman