
MATLAB: An Introduction with Applications
6th Edition
ISBN: 9781119256830
Author: Amos Gilat
Publisher: John Wiley & Sons Inc
expand_more
expand_more
format_list_bulleted
Related questions
Question
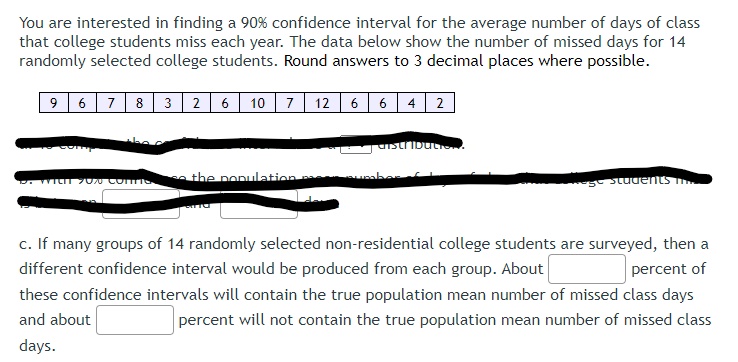

Transcribed Image Text:You are interested in finding a 90% confidence interval for the average number of days of class
that college students miss each year. The data below show the number of missed days for 14
randomly selected college students. Round answers to 3 decimal places where possible.
9678 3 26 10 7 12 6 6 4 2
with 70% confies the population
distribut
sumber I
students
c. If many groups of 14 randomly selected non-residential college students are surveyed, then a
different confidence interval would be produced from each group. About
percent of
these confidence intervals will contain the true population mean number of missed class days
and about
percent will not contain the true population mean number of missed class
days.
Expert Solution
This question has been solved!
Explore an expertly crafted, step-by-step solution for a thorough understanding of key concepts.

Step by stepSolved in 2 steps with 2 images

Knowledge Booster

Similar questions
- A certain statistics instructor participates in triathlons. The accompanying table lists times (in minutes and seconds) he recorded while riding a bicycle for five laps through each mile of a 3-mile loop. Use a 0.05 significance level to test the claim that it takes the same time to ride each of the miles. Does one of the miles appear to have a hill? LOADING... Click the icon to view the data table of the riding times. Question content area bottom Part 1 Determine the null and alternative hypotheses. H0: ▼ mu 1 greater than mu 2 greater than mu 3μ1>μ2>μ3 mu 1 not equals mu 2 not equals mu 3μ1≠μ2≠μ3 Exactly two of the population means are different from each other.Exactly two of the population means are different from each other. At least one of the three population means is different from the others.At least one of the three population means is different from the others. mu 1 equals mu 2 equals mu 3μ1=μ2=μ3 H1: ▼ mu 1 greater than mu 2…arrow_forwardQ个4 3 of 6 200% 5.) If the number 12.3 were added to the dataset below, which statement best describes how its mean and median would change? 70.1, 72.3, 75.6, 78.9, 81.0, 83.8, 84.5, 91.2 A.) The mean and median both decrease, but the mean decreases more. B.) The mean and median both decrease, but the median decreases more. C.) The median doesn't change, but the mean decreases. D.) The mean doesn't change, but the median decreases. 021 Illuminate EducationTM, Inc. ? XP OCa 29arrow_forwardWhich of the following would not be consideredarrow_forward
- each item # 7-8. 7. Researchers study the effect of political commercials and the likelihood of people inspired to vote for former President Trump in the 2024 presidential election. They show a political commercial to a random sample 150 people. The researchers found a 90% confidence interval for the proportion of people who were influenced to vote for former President Trump after viewing the political commercial to be (0.56, 0.72). Which is true based on the given confidence interval? Select the two correct answers. e. a. We are 90% confident that the true proportion of people inspired to vote for former President Trump after viewing a political commercial is between 0.56 and 0.72. b. 90% of all 90% confidence intervals constructed in this way will capture the true proportion of people inspired to vote for former President Trump after viewing a political commercial. c. We're 90% sure that the proportion of people in this research sample inspired to vote for Sve former President Trump…arrow_forwardMr Alsup asked the studentS in his third-and sixth-period English classes whether they had chosen a topic for thier writing assignment. he recorded the data in a two-way table, as shown below English class Yes No Total Third period 24 6 30 Sixth period 22 3 25 Total 46 9 55 if jannette in in mr alsup sixth-period english class what is the probablity that she has not chosen a topic for her writing assignment? a- 3% b- 5% c- 12% d-14%arrow_forwardA medical doctor is interested in determining whether mean body temperatures are different in the morning and at night. Five patients were recruited and their body temperatures were measured first at 8 AM and then again at 10 PM. The data is in the following table: Patient 1 3 14 5 Morning 98.0 97.6 97.2 97.0 98.0 Night 97.0 98.8 97.6 97.7 98.8 For this matched pairs experiment, you should take the differences by calculating: Morning Night. What is the alternative hypothesis of interest? OH1 : HD 0 O H1 : µp # 0 Next Page Page 4 of 15 126 NOV 18 MacBook Proarrow_forward
arrow_back_ios
arrow_forward_ios
Recommended textbooks for you
- MATLAB: An Introduction with ApplicationsStatisticsISBN:9781119256830Author:Amos GilatPublisher:John Wiley & Sons Inc
 Probability and Statistics for Engineering and th...StatisticsISBN:9781305251809Author:Jay L. DevorePublisher:Cengage Learning
 Statistics for The Behavioral Sciences (MindTap C...StatisticsISBN:9781305504912Author:Frederick J Gravetter, Larry B. WallnauPublisher:Cengage Learning
  Elementary Statistics: Picturing the World (7th E...StatisticsISBN:9780134683416Author:Ron Larson, Betsy FarberPublisher:PEARSON
 The Basic Practice of StatisticsStatisticsISBN:9781319042578Author:David S. Moore, William I. Notz, Michael A. FlignerPublisher:W. H. Freeman
 Introduction to the Practice of StatisticsStatisticsISBN:9781319013387Author:David S. Moore, George P. McCabe, Bruce A. CraigPublisher:W. H. Freeman
MATLAB: An Introduction with Applications
Statistics
ISBN:9781119256830
Author:Amos Gilat
Publisher:John Wiley & Sons Inc
Probability and Statistics for Engineering and th...
Statistics
ISBN:9781305251809
Author:Jay L. Devore
Publisher:Cengage Learning
Statistics for The Behavioral Sciences (MindTap C...
Statistics
ISBN:9781305504912
Author:Frederick J Gravetter, Larry B. Wallnau
Publisher:Cengage Learning
Elementary Statistics: Picturing the World (7th E...
Statistics
ISBN:9780134683416
Author:Ron Larson, Betsy Farber
Publisher:PEARSON
The Basic Practice of Statistics
Statistics
ISBN:9781319042578
Author:David S. Moore, William I. Notz, Michael A. Fligner
Publisher:W. H. Freeman
Introduction to the Practice of Statistics
Statistics
ISBN:9781319013387
Author:David S. Moore, George P. McCabe, Bruce A. Craig
Publisher:W. H. Freeman