MATLAB: An Introduction with Applications
6th Edition
ISBN: 9781119256830
Author: Amos Gilat
Publisher: John Wiley & Sons Inc
expand_more
expand_more
format_list_bulleted
Concept explainers
Question

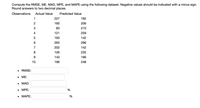
Transcribed Image Text:Compute the RMSE, ME, MAD, MPE, and MAPE using the following dataset. Negative values should be indicated with a minus sign.
Round answers to two decimal places.
Observations
Actual Value
Predicted Value
1
227
192
160
206
3
83
210
4
121
259
193
142
263
296
7
202
142
8
126
235
143
196
10
196
24
• RMSE:
• ME:
• MAD:
. MPЕ:
%
. МАРЕ:
Expert Solution
This question has been solved!
Explore an expertly crafted, step-by-step solution for a thorough understanding of key concepts.
This is a popular solution
Trending nowThis is a popular solution!
Step by stepSolved in 2 steps

Knowledge Booster
Learn more about
Need a deep-dive on the concept behind this application? Look no further. Learn more about this topic, statistics and related others by exploring similar questions and additional content below.Similar questions
- Typed please and asaparrow_forwardPlease solve and explain #2arrow_forwardThe boxplot shown below results from the heights (cm) of males listed in a data set. What do the numbers in that boxplot tell us? 151 172.5 192 168.5 182.6 A boxplot consists of a box that extends from 168.5 to 182.6, a vertical line segment drawn through the box at 172.5, and a horizontal line segment extending from a vertical line segment at 151 to a vertical line segment at 192 that bisects the box. Question content area bottom Part 1 The minimum height is enter your response here cm, the first quartile Q1 is enter your response here cm, the second quartile Q2 (or the median) is enter your response here cm, the third quartile Q3 is enter your response here cm, and the maximum height is enter your response here cm. (Type integers or decimals. Do not round.)arrow_forward
- Solve. 4) Construct a box plot from the data below. 20 25 26 26 26 272933 41 43 45 46 47 4850 50 50 51 53 55 57 60 61 62 63arrow_forwardUse this data which give the dosage levels for a particular drug and the heart rate measured 30 minutes after taking the drug. Dose (mg) Heart rate 0.125 95 0.20 90 0.25 93 0.30 92 0.35 88 0.40 80 0.50 82 Create a scatter plot. Use your Ti-84arrow_forwardA histogram titled "20 Busiest North American Airports" has a horizontal axis labeled "Total Passengers (Millions)" and a vertical axis labeled "Frequency" with values from 0 to 10. The histogram has 8 bars. Each bar is associated with a label and an approximate value as listed below. Frequency 10 O 0 7 02 8 3 30-39.9 20 Busiest North American Airports 40-49.9 50-59.9 Total Passengers (Millions) What is the lowest frequency value? 60-69.9 70-79.9 80-89.9 90-99.9 100-109.9arrow_forward
- ExQm Score Oata 76 69 64 75 70 80 90 86 77 79 82 96 51 64 95 6.2 76 65 68 74 Oc Mahe a box- and whiskar plot d alculus data Examarrow_forwardThe authors of a paper were interested in how the distance a deer mouse will travel for food is related to the distance from the food to the nearest pile of debris. Distances were measured in meters. The data and computer output are given below. Distance from Debris Distance Traveled 6.94 0.00 5.23 6.13 5.21 11.29 7.10 14.35 8.16 12.03 5.50 22.72 9.19 20.11 9.05 26.16 9.36 30.65 Simple Linear Regression Results: Dependent Variable: Traveled Independent Variable: Debris Sample size: 9 R (correlation coefficient) = 0.5657 R-sq = 0.32002088 Estimate of error standard deviation 8.670711 Parameter estimates: Parameter Estimate Std. Err. Alternative DF T-Stat P-Value Intercept -7.6854587 13.332196 ≠ 0 7 -0.5764586 0.5824 Slope 3.2340908 1.7818117 ≠ 0 7 1.8150575 0.1124 a)What is the least squares regression line for the output given above? b) what is the predicted traveled distance given the distance from debris is 6.5 meters?arrow_forwardCalculate the five-number summary of the given data. Use the approximation method. Enter your answer in ascending order, separating each answer with a comma. 25, 20, 10, 16, 25, 21, 11, 8, 21, 8, 12, 5, 6, 20, 4 Answer Keypa Keyboard Short Tablesarrow_forward
arrow_back_ios
arrow_forward_ios
Recommended textbooks for you
 MATLAB: An Introduction with ApplicationsStatisticsISBN:9781119256830Author:Amos GilatPublisher:John Wiley & Sons Inc
 Probability and Statistics for Engineering and th...StatisticsISBN:9781305251809Author:Jay L. DevorePublisher:Cengage Learning
 Statistics for The Behavioral Sciences (MindTap C...StatisticsISBN:9781305504912Author:Frederick J Gravetter, Larry B. WallnauPublisher:Cengage Learning
 Elementary Statistics: Picturing the World (7th E...StatisticsISBN:9780134683416Author:Ron Larson, Betsy FarberPublisher:PEARSON
 The Basic Practice of StatisticsStatisticsISBN:9781319042578Author:David S. Moore, William I. Notz, Michael A. FlignerPublisher:W. H. Freeman
 Introduction to the Practice of StatisticsStatisticsISBN:9781319013387Author:David S. Moore, George P. McCabe, Bruce A. CraigPublisher:W. H. Freeman

MATLAB: An Introduction with Applications
Statistics
ISBN:9781119256830
Author:Amos Gilat
Publisher:John Wiley & Sons Inc

Probability and Statistics for Engineering and th...
Statistics
ISBN:9781305251809
Author:Jay L. Devore
Publisher:Cengage Learning

Statistics for The Behavioral Sciences (MindTap C...
Statistics
ISBN:9781305504912
Author:Frederick J Gravetter, Larry B. Wallnau
Publisher:Cengage Learning

Elementary Statistics: Picturing the World (7th E...
Statistics
ISBN:9780134683416
Author:Ron Larson, Betsy Farber
Publisher:PEARSON

The Basic Practice of Statistics
Statistics
ISBN:9781319042578
Author:David S. Moore, William I. Notz, Michael A. Fligner
Publisher:W. H. Freeman

Introduction to the Practice of Statistics
Statistics
ISBN:9781319013387
Author:David S. Moore, George P. McCabe, Bruce A. Craig
Publisher:W. H. Freeman