
Related questions
Study the diagram below and answer the question.
Which one of the following statements is false?
A Y1 represents the equilibrium level of income.
B The curve labelled A = C + I shows the total of consumption and investment spending.
C The curve labelled C shows the total of autonomous and induced consumption spending.
D The point labelled D shows where savings equal investment.
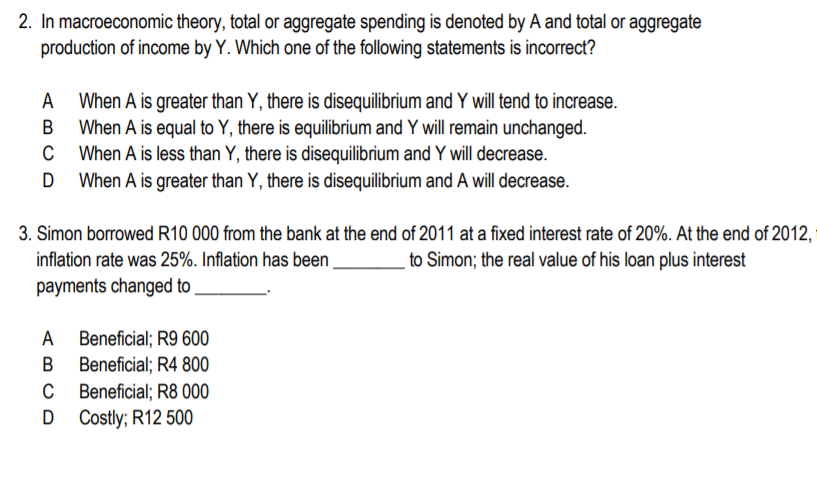
In
production of income by Y. Which one of the following statements is incorrect?
A When A is greater than Y, there is disequilibrium and Y will tend to increase.
B When A is equal to Y, there is equilibrium and Y will remain unchanged.
C When A is less than Y, there is disequilibrium and Y will decrease.
D When A is greater than Y, there is disequilibrium and A will decrease.


Trending nowThis is a popular solution!

Step by stepSolved in 4 steps


- In an economy C= 300 + 0.6Y and I= 400 C is denoted to be as the Consumption Y is the Income and I is the Investment. Equilibrium level of Income.?arrow_forwarded The figure shows planned aggregate expenditure and output for an economy. PAE=Y Planned Aggregate Expenditure (PAE) PAE PAE2 PAE, Y₂ Y3 Actual Aggregate Expenditure (Output or GDP, Y) Suppose that the economy starts at PAE2. What change would cause a move from PAE2 to PAE₁? Multiple Choice Consumption increases Exports increase. Government spending decreases. Investment increasesarrow_forward1.12 Study the following diagram and answer the question that follows. Expenditures (billions of dollars per year) > > 3500 3000 2500 2000 1500 1000 500 Figure 9.1 500 1000 1500 2000 2500 3000 3500 Income (billions of dollars per yazari At an income level of $2,000 billion, a) Consumption equals $1,500 billion. b) Saving equals $0. c) The MPC equals 0.80. d) There is dissaving. F 뉴 C connexarrow_forward
- 2. Suppose you are economist and have the following data: Consumption; Income; 75 253 85 185 98 212 108 180 118 185 You want to investigate the effect of income on consumption. a)Write and estimate your model b)interpret the resultsarrow_forwarda. The key idea of the aggregate expenditure model is that in any particular year, the level of GDP is determined mainly by A) investment spending. B) export spending. C) government spending. D) the level of aggregate expenditure. b. U.S. net export rises when A) the price level in the United States rises relative to the price level in other countries. B) the growth rate of U.S. GDP is slower than the growth rate of GDP in other countries. C) the value of the U.S. dollar increases relative to other currencies. D) the inflation rate is higher in the United States relative to other countries.arrow_forward25arrow_forward
- 11:04 AM ECON 122 CAT ONE.docX Phoenix Files QUESTION ONE Is it desirable for a country to have a large gross domestic product? Explain (2 marks) QUESTION TWO You are given data on the following variables in an economy Government spending 300 Planned investment Net exports Autonomous taxes Income tax rate Marginal propensity to consume 0.5 a) Consumption (C) is 600 when income (Y) is equal to 1500. Solve for autonom ous consumption (2 ma rks) ii) 200 S 50 b) Solve for the equilibrium level of output in the following two scenarios: i) There is an income tax t=0.1, Edit 0.1 250 Q Search © | 46| 472 [ 66 c) In the economy with an income tax of 10%, what is the budget balance of the government? (2 marks) O X: × There is no income tax in the economy. Denote these two variables by Yw and YN respectively. (4 marks) d) Solve for the change in net exports that would bring the equilibrium output lev el in the economy with the income tax to the level of YN that you found in part b. specify both…arrow_forwardUse the graph to answer the following questions: a)what is the value of the MPC? b)what is the value of the MPS?arrow_forwardTHE AGGREGATE EXPENDITURE MODEL (IN THE SHORT RUN)YOU MUST SHOW YOUR CALCULATIONS IN THE SPACE BELOWFOR THE NEXT PROBLEM USE THE FOLLOWING FORMULA:CHANGE IN GDP = [ 1 / (1-MPC) ] * CHANGE IN GInitially, the economy is producing $13 trillion in goods and services and the government is spending $2 trillion.Then the government decides to increase its spending to $2.7 trillion. What is the value of the spending multiplier?arrow_forward
- Aggregate Expenditures and Multipliers Assignment a. Using the aggregate expenditure function above, what is the current level of real GDP? b. Using the aggregate expenditure function above, what would be the level of real GDP if the aggregate expenditure function shifted up by $0.2T? c. If Investment expenditures increase by $300B and MPC is equal to 0.90, what will be the increase in real GDP? d. If Government expenditures increase by $800B and MPS is equal to 0.05, what will be the increase in real GDP?arrow_forwardQuestion 3 of 16 Income and consumption changes for five people are shown in the table. Given this information, rank the marginal propensities to consume (MPC) for the five people from largest to smallest. Largest MPC Smallest MPC Answer Bank Bert Doug Eli Carter Al Name Income change Consumption change Al +$5,000+$5,000 +$3,000+$3,000 Bert +$2,500+$2,500 +$800+$800 Carter +$1,000+$1,000 +$800+$800 Doug −$2,500−$2,500 −$1,750−$1,750 Eli −$5,000−$5,000 −$2,000−$2,000arrow_forwardMacmillan Learning (Table: Consumption and Savings) Based on the table, the marginal propensity to consume is propensity to consume Income Consumption Spending Saving $30,000 $30,000 $0 40,000 35,000 5,000 50,000 40,000 10,000 0.5; varies with the level of income $5,000; is $5,000 $10,000; is $35,000 2; varies with the level of income and the averagearrow_forward
 Principles of Economics (12th Edition)EconomicsISBN:9780134078779Author:Karl E. Case, Ray C. Fair, Sharon E. OsterPublisher:PEARSON
 Engineering Economy (17th Edition)EconomicsISBN:9780134870069Author:William G. Sullivan, Elin M. Wicks, C. Patrick KoellingPublisher:PEARSON
 Principles of Economics (MindTap Course List)EconomicsISBN:9781305585126Author:N. Gregory MankiwPublisher:Cengage Learning
 Managerial Economics: A Problem Solving ApproachEconomicsISBN:9781337106665Author:Luke M. Froeb, Brian T. McCann, Michael R. Ward, Mike ShorPublisher:Cengage Learning
 Managerial Economics & Business Strategy (Mcgraw-...EconomicsISBN:9781259290619Author:Michael Baye, Jeff PrincePublisher:McGraw-Hill Education