
ENGR.ECONOMIC ANALYSIS
14th Edition
ISBN: 9780190931919
Author: NEWNAN
Publisher: Oxford University Press
expand_more
expand_more
format_list_bulleted
Related questions
Question
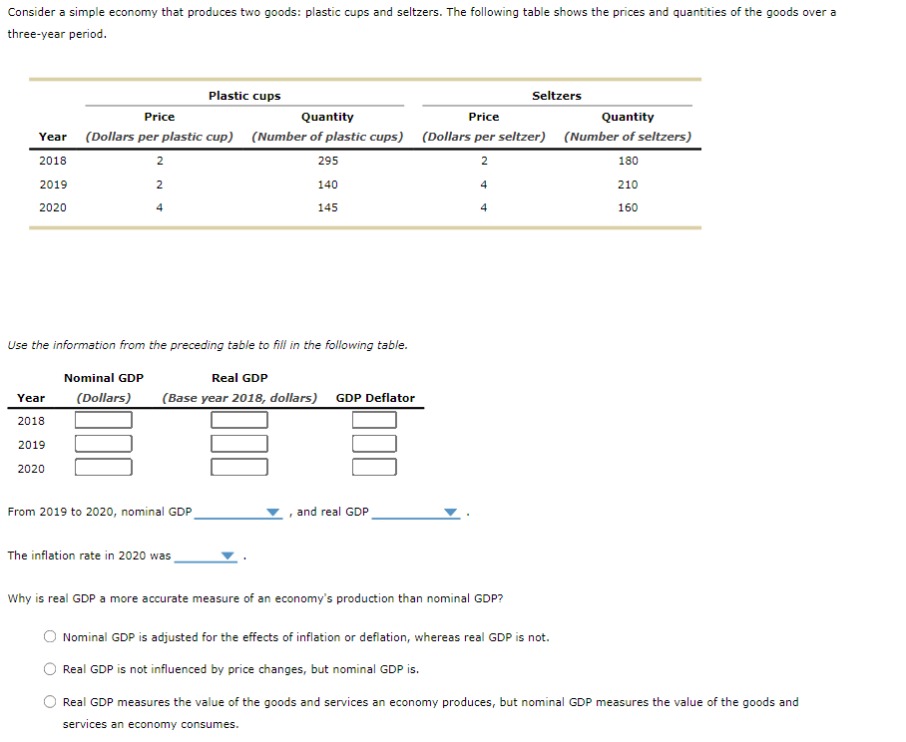

Transcribed Image Text:Consider a simple economy that produces two goods: plastic cups and seltzers. The following table shows the prices and quantities of the goods over a
three-year period.
2019
2020
Price
Quantity
Price
Quantity
Year (Dollars per plastic cup) (Number of plastic cups) (Dollars per seltzer) (Number of seltzers)
2018
2
180
4
210
4
160
Year
2018
2
2
4
2019
2020
Use the information from the preceding table to fill in the following table.
Nominal GDP
Real GDP
(Dollars) (Base year 2018, dollars) GDP Deflator
Plastic cups
From 2019 to 2020, nominal GDP
The inflation rate in 2020 was
295
140
145
and real GDP
Seltzers
Why is real GDP a more accurate measure of an economy's production than nominal GDP?
Nominal GDP is adjusted for the effects of inflation or deflation, whereas real GDP is not.
Real GDP is not influenced by price changes, but nominal GDP is.
Real GDP measures the value of the goods and services an economy produces, but nominal GDP measures the value of the goods and
services an economy consumes.
Expert Solution
This question has been solved!
Explore an expertly crafted, step-by-step solution for a thorough understanding of key concepts.

This is a popular solution

Trending nowThis is a popular solution!

Step by stepSolved in 6 steps with 4 images

Knowledge Booster


Learn more about
Need a deep-dive on the concept behind this application? Look no further. Learn more about this topic, economics and related others by exploring similar questions and additional content below.Similar questions
- 16. Nominal GDP differs from real GDP because nominal GDP is based on constant pricesreal GDP is based on current pricesreal GDP is adjusted for changes in the price levelnominal GDP is adjusted for changes in the price levelarrow_forwardGDP in the U.S. in 2000 was $10.1 trillion dollars and GDP in 2008 was $14.3 trillion. The CPI in 2000 was 172.2 and the CPI in 2008 was 215.3 (The CPI in 2009 was 214.5) What was Real GDP in 2008 (in 2009 $)? $14.25 trillion $11.48 trillion $17.81 trillion $14.35 trillion Question 30 (S What was the economic growth rate between 2000 and 2008? Growth rate= RGDP (2)-RGDP (1) 100 RGDP (1) Aarrow_forward3. Consider an economy that only produces mittens. In Year 1, 4000 pairs of mittens are produced and the price is $5 per pair. In the Year 2, 5000 pairs of mittens are produced and the price is $7 per pair. In Year 3, 7000 pair of mittens are produced and the price is $9 per pair. Use Year 1 as the base year. What is the nominal GDP for each year? What is the real GDP for each year? What is the GDP deflator for each year? What is the percentage growth rate of real GDP from year 2 to year 3? What is the inflation rate (as measured by the GDP deflator) from year 2 to year 3?arrow_forward
- Consider a simple economy that produces two goods: plastic cups and donuts. The following table shows the prices and quantities of the goods over a three-year period. Plastic cups Donuts Price Quantity Price Quantity Year (Dollars per plastic cup) (Number of plastic cups) (Dollars per donut) (Number of donuts) 2018 2 215 3 155 2019 4. 135 3 210 2020 2 150 3 190 Use the information from the preceding table to fill in the following table. Nominal GDP (Dollars) Real GDP (Base year 2018, dollars) GDP Deflator Year 2018 2019 2020 From 2019 to 2020, nominal GDP and real GDP The inflation rate in 2020 wasarrow_forwardFirst, define nominal GDP and real GDP. Second, is it possible for nominal GDP in a year to be less than real GDP in the same year? Explain. (100 words max)arrow_forwardUse following data to answer following questions. A country produces only milk and honey. The base Year 2016 2017 2018 Price of Milk $1 $2 $3 Quantity of Milk 100 Quarts 200 Quarts 200 Quarts year is 2016. Price of Honey $2 $2 $4 Quantity of Honey 50 Quarts 100 Quarts 100 Quarts C):1 a. Calculate the nominal GDP for 2016, 2017 and 2018. b. Calculate real GDP for 2016, 2017, and 2018. c. Calculate growth rate of nominal and real GDP for 2017 and 2018. d. Are nominal and real GDPs same for a given year? Please explain. e. Calculate the inflation rates for 2017 and 2018 using GDP deflator method.arrow_forward
arrow_back_ios
arrow_forward_ios
Recommended textbooks for you
 Principles of Economics (12th Edition)EconomicsISBN:9780134078779Author:Karl E. Case, Ray C. Fair, Sharon E. OsterPublisher:PEARSON
 Engineering Economy (17th Edition)EconomicsISBN:9780134870069Author:William G. Sullivan, Elin M. Wicks, C. Patrick KoellingPublisher:PEARSON
 Principles of Economics (MindTap Course List)EconomicsISBN:9781305585126Author:N. Gregory MankiwPublisher:Cengage Learning
 Managerial Economics: A Problem Solving ApproachEconomicsISBN:9781337106665Author:Luke M. Froeb, Brian T. McCann, Michael R. Ward, Mike ShorPublisher:Cengage Learning
 Managerial Economics & Business Strategy (Mcgraw-...EconomicsISBN:9781259290619Author:Michael Baye, Jeff PrincePublisher:McGraw-Hill Education
Principles of Economics (12th Edition)
Economics
ISBN:9780134078779
Author:Karl E. Case, Ray C. Fair, Sharon E. Oster
Publisher:PEARSON
Engineering Economy (17th Edition)
Economics
ISBN:9780134870069
Author:William G. Sullivan, Elin M. Wicks, C. Patrick Koelling
Publisher:PEARSON
Principles of Economics (MindTap Course List)
Economics
ISBN:9781305585126
Author:N. Gregory Mankiw
Publisher:Cengage Learning
Managerial Economics: A Problem Solving Approach
Economics
ISBN:9781337106665
Author:Luke M. Froeb, Brian T. McCann, Michael R. Ward, Mike Shor
Publisher:Cengage Learning
Managerial Economics & Business Strategy (Mcgraw-...
Economics
ISBN:9781259290619
Author:Michael Baye, Jeff Prince
Publisher:McGraw-Hill Education