
MATLAB: An Introduction with Applications
6th Edition
ISBN: 9781119256830
Author: Amos Gilat
Publisher: John Wiley & Sons Inc
expand_more
expand_more
format_list_bulleted
Related questions
Concept explainers
Topic Video
Question
thumb_up100%

Transcribed Image Text:labus
Question 3
ople
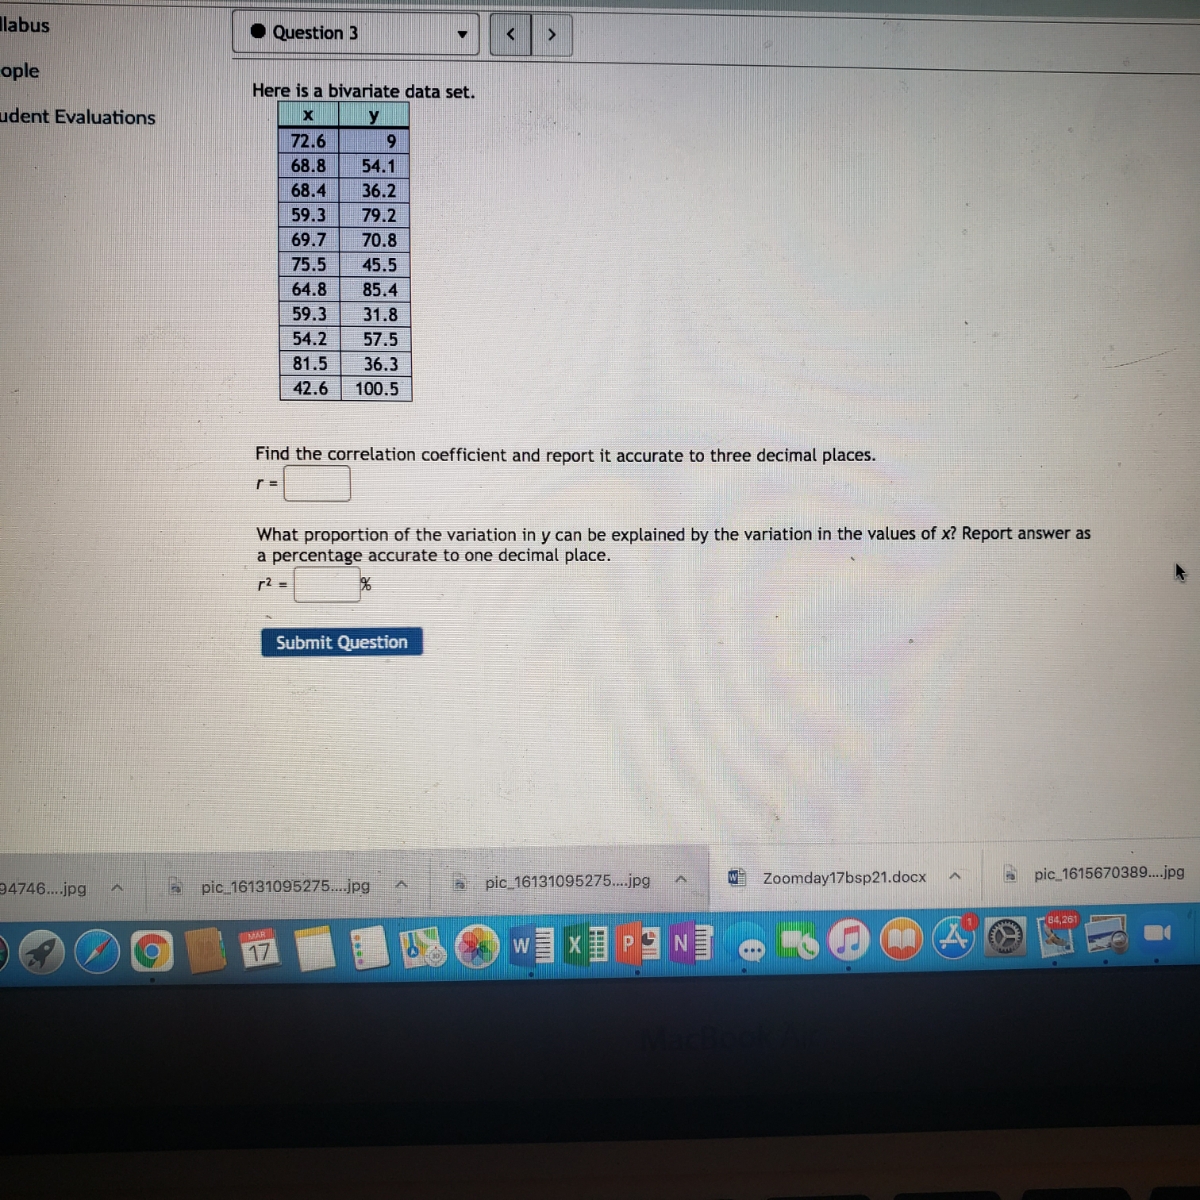
Here is a bivariate data set.
udent Evaluations
y
72.6
68.8
54.1
68.4
36.2
59.3
79.2
69.7
70.8
75.5
45.5
64.8
85.4
59.3
31.8
54.2
57.5
81.5
36.3
42.6
100.5
Find the correlation coefficient and report it accurate to three decimal places.
What proportion of the variation in y can be explained by the variation in the values of x? Report answer as
a percentage accurate to one decimal place.
r2 =
Submit Question
a pic_16131095275...jpg
Zoomday17bsp21.docx
A pic 1615670389...jpg
94746..jpg
pic 16131095275..jpg
W X
Expert Solution
This question has been solved!
Explore an expertly crafted, step-by-step solution for a thorough understanding of key concepts.

Step by stepSolved in 2 steps

Knowledge Booster


Learn more about
Need a deep-dive on the concept behind this application? Look no further. Learn more about this topic, statistics and related others by exploring similar questions and additional content below.Similar questions
- please answer the question in the photo, charts also attacthed in second photoarrow_forwardW L 1.4 1.91.4 1.81.5 1.91.9 2.32.1 3.52.1 2.82.1 2.72.2 3.02.2 2.72.3 3.02.4 3.22.4 2.92.5 3.52.5 3.32.6 3.52.6 3.42.6 3.42.7 3.22.8 3.82.8 3.52.9 3.82.9 3.92.9 3.82.9 3.73.0 3.83.0 4.03.0 3.73.1 4.13.4 4.43.4 4.33.5 4.53.6 4.63.6 4.83.6 4.93.6 4.53.7 4.93.9 5.43.9 5.24.1 5.34.1 5.44.1 5.24.2 5.44.2 5.54.2 5.64.2 5.24.3 5.64.7 6.14.8 6.64.8 6.14.8 6.04.9 6.15.0 6.65.0 6.25.1 6.65.2 6.45.2 6.85.4 6.35.6 7.05.6 7.95.8 7.45.8 7.45.8 6.95.9 7.96.0 7.76.0 7.86.0 7.36.2 8.56.2 7.56.3 7.66.5 9.36.6 8.16.6 8.06.7 8.26.7 9.26.7 8.06.7 7.96.9 8.66.9 8.17.0 9.57.1 9.17.1 9.17.1 9.47.2 8.47.3 9.37.3 8.97.4 8.97.5 8.6 match the number to the corresponding residualarrow_forwardIn a test of the effectiveness of garlic for lowering cholesterol, 50 subjects were treated with garlic in a processed tablet form. Cholesterol levels were measured before and after the treatment. The changes (before - after) in their levels of LDL cholesterol (in mg/dL) have a mean of 3.2 and a standard deviation of 17.5. Construct a 95% confidence interval estimate of the mean net change in LDL cholesterol after the garlic treatment. What does the confidence interval suggest about the effectiveness of garlic in reducing LDL cholesterol? Click here to view at distribution table. Click here to view page 1 of the standard normal distribution table. Click here to view page 2 of the standard normal distribution table. C What is the confidence interval estimate of the population mean µ? mg/dL <μ< mg/dL (Round to two decimal places as needed.) What does the confidence interval suggest about the effectiveness of the treatment? O A. The confidence interval limits do not contain 0, suggesting…arrow_forward
- urgent pleqasearrow_forwardMag Depth 2.96 19.9 2.73 6.5 1.46 3.5 0.85 13.3 2.95 19.9 1.63 8.7 1.92 18.4 1.12 7.9 2.59 3.1 1.68 9.4 0.14 6.2 2.43 17.7 0.04 18.4 1.03 9.8 2.89 12.4 0.54 9.5 0.77 2.1 1.87 8.1 2.72 17.3 0.84 9.9 1.48 12.7 0.68 7.1 1.83 17.1 1.89 3.4 0.94 13.8 2.24 5.7 0.94 16.7 1.36 5.2 0.98 6.6 0.51 12.5 2.69 14.1 1.73 12.5 2.29 12.7 1.63 14.7 0.52 18.6 2.75 4.5 2.31 10.5 1.39 13.3 2.05 10.5 0.63 5.7 1.15 3.6 1.59 2.9 2.92 11.3 0.33 6.4 2.78 9.2 1.43 4.8 0.82 4.8 0.21 13.6 1.77 12.3 0.68 4.9 1) Check Image 2) Given that the earthquake has a magnitude of 1.1, the best predicted depth is km. (Round to one decimal place as needed.)arrow_forwardFind the LU factorization of and use it to solve the system A = -4 16 10 -2 -2 2 -2 2 -3 6 -9 -5 -7 X2 10-0 -4 -7 -10 -22 2 6 -9 -5 -7 -4 16 1 -4 10 -7 -10 -22 A = LU 4 = -13 32 -14arrow_forward
arrow_back_ios
arrow_forward_ios
Recommended textbooks for you
- MATLAB: An Introduction with ApplicationsStatisticsISBN:9781119256830Author:Amos GilatPublisher:John Wiley & Sons Inc
 Probability and Statistics for Engineering and th...StatisticsISBN:9781305251809Author:Jay L. DevorePublisher:Cengage Learning
 Statistics for The Behavioral Sciences (MindTap C...StatisticsISBN:9781305504912Author:Frederick J Gravetter, Larry B. WallnauPublisher:Cengage Learning
  Elementary Statistics: Picturing the World (7th E...StatisticsISBN:9780134683416Author:Ron Larson, Betsy FarberPublisher:PEARSON
 The Basic Practice of StatisticsStatisticsISBN:9781319042578Author:David S. Moore, William I. Notz, Michael A. FlignerPublisher:W. H. Freeman
 Introduction to the Practice of StatisticsStatisticsISBN:9781319013387Author:David S. Moore, George P. McCabe, Bruce A. CraigPublisher:W. H. Freeman
MATLAB: An Introduction with Applications
Statistics
ISBN:9781119256830
Author:Amos Gilat
Publisher:John Wiley & Sons Inc
Probability and Statistics for Engineering and th...
Statistics
ISBN:9781305251809
Author:Jay L. Devore
Publisher:Cengage Learning
Statistics for The Behavioral Sciences (MindTap C...
Statistics
ISBN:9781305504912
Author:Frederick J Gravetter, Larry B. Wallnau
Publisher:Cengage Learning
Elementary Statistics: Picturing the World (7th E...
Statistics
ISBN:9780134683416
Author:Ron Larson, Betsy Farber
Publisher:PEARSON
The Basic Practice of Statistics
Statistics
ISBN:9781319042578
Author:David S. Moore, William I. Notz, Michael A. Fligner
Publisher:W. H. Freeman
Introduction to the Practice of Statistics
Statistics
ISBN:9781319013387
Author:David S. Moore, George P. McCabe, Bruce A. Craig
Publisher:W. H. Freeman