
Related questions
Concept explainers
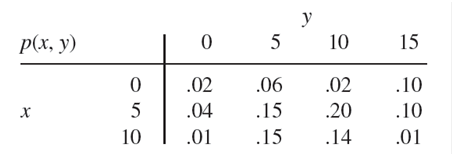
An instructor has given a short quiz consisting of nvo parts. For a randomly selected student, let X= the number of points earned on the first part and Y= the number of points earned on the second part. Suppose that thejoint pmf of X and Yis given in the accompanying table.
a. If the score recorded in the grade book is the total number of points earned on the nvo parts,what isthe expected recorded score E(X + Y)?
b. If the maximum of the two scores is recorded,what isthe expected recorded score?
A random variable is
- Sketch a normal curve for the
probability density Label the horizontal ax. is with values of 35, 40, 45, 50, 55, 60, and 65. Figure 6.4 shows that the normal curve almost touches the horizontal axis at three standard deviations below and at
three standard deviations above the mean (in this case at 35 and 65).
- What is the probability the random variable will assume a value between 45 and 55?
- what is the probability the random variable will assume a value between 40 and 60?


Trending nowThis is a popular solution!

Step by stepSolved in 3 steps with 2 images


- Find the P-value (to 4 decimals) for a x test with d. f. = 10 and STS X = 13 if the test is: %3D a. Left tailed: b. Right tailed: c. Two-tailed: Submit Questionarrow_forwardThe results of a one sample t test are reported as follows: T(24) = 1.70, p>.05. Based on these results how many participants were in the sample?arrow_forwardQ. 24 What is the difference between absolute and relative dispersion?arrow_forward
- A researcher found that the two groups (n=25 in each group) they tested were significantly different from each other with a t-value of 2.91, which has a corresponding p-value of p=.06. Report the findings in APA number format.arrow_forwardYour p value is .03 and you chose your α level to be .05. What kind of error could you be making? a. Type I error b. Type II error c. Type I and Type II error d. Neither errorsarrow_forwardConsider the quantities µ1, σ1, x1, s1, µ2, σ2, x2, and s2. a. Which quantities represent parameters and which represent statistics?b. Which quantities are fixed numbers and which are variables?arrow_forward
- A sample of n = 12 scores has a mean of M = 8. What is the value of EX for this sample? Ο ΣΧ- 1.5 Ο ΣΧ-4 Ο ΣΧ-20 Ο ΣΧ- 96arrow_forwardA population has SS = 30 and σ2 = 3. How many scores are in the population?arrow_forwardLas Vegas has seen increased competition from Singapore and Macau for customers in the casino resort industry. One measurement of success is the average length of stay by visitors. The data in this file show the number of days a random sample of visitors stayed at each location. a. Using α = 0.05 to determine if there is a difference in the average length of stay by visitors for the three locations. Follow the steps as outlined in the exercises. b. If warranted, perform a multiple comparison test to determine which pairs are different using α = 0.05. c. Verify your results using Excel.arrow_forward
- cmid=855541&page=28 page n F5 Pat received the following grades in four classes. In Pat's History class, what is the percentage of students scoring higher than Pat? (round to two decimal places, don't include the % sign in your answer) % Subject Psychology Math History English Answer: F6 + W F7 Pat's Grade 75 90 86 83 W & F8 Class Mean 83 85 80 88 Pa F9 F10 Class Standard Deviation 8 6 4 A X F11 * F12 Home End Insert +1 Time left 1:35:4 Next page 12:54 PM *A*G 2/17/2023 Q T495S Delete Backspacearrow_forwardcan you answer C,E, F E: accept, reject, or fail to rejectarrow_forwardA researcher want to know if there is a relationship between sleep and anxiety. The researcher randomly selected n = 5 participants and asked each to rate their sleep quality and anxiety level on a scale of 1 to 5. The data are below: Sleep X Anxiety Y 2 2 3 3 2 2 4 2 5 2 Calculate Pearson's rarrow_forward
- MATLAB: An Introduction with ApplicationsStatisticsISBN:9781119256830Author:Amos GilatPublisher:John Wiley & Sons Inc
 Probability and Statistics for Engineering and th...StatisticsISBN:9781305251809Author:Jay L. DevorePublisher:Cengage Learning
 Statistics for The Behavioral Sciences (MindTap C...StatisticsISBN:9781305504912Author:Frederick J Gravetter, Larry B. WallnauPublisher:Cengage Learning
  Elementary Statistics: Picturing the World (7th E...StatisticsISBN:9780134683416Author:Ron Larson, Betsy FarberPublisher:PEARSON
 The Basic Practice of StatisticsStatisticsISBN:9781319042578Author:David S. Moore, William I. Notz, Michael A. FlignerPublisher:W. H. Freeman
 Introduction to the Practice of StatisticsStatisticsISBN:9781319013387Author:David S. Moore, George P. McCabe, Bruce A. CraigPublisher:W. H. Freeman