
ENGR.ECONOMIC ANALYSIS
14th Edition
ISBN: 9780190931919
Author: NEWNAN
Publisher: Oxford University Press
expand_more
expand_more
format_list_bulleted
Related questions
Question
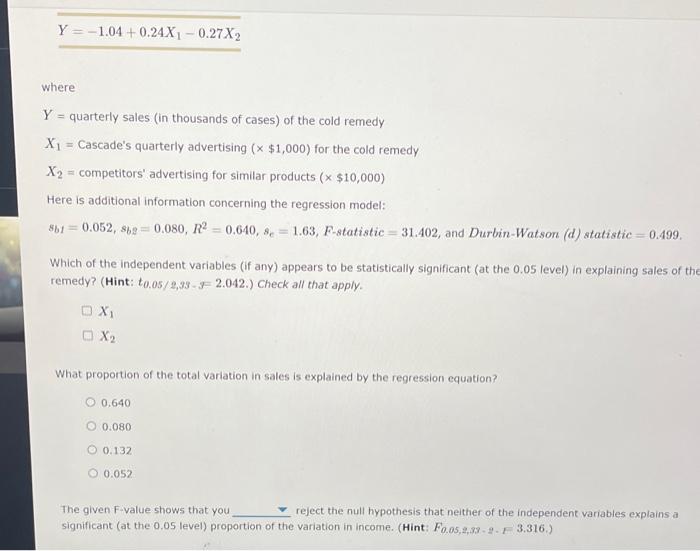

Transcribed Image Text:Y-1.04 +0.24X₁-0.27X2
where
Y = quarterly sales (in thousands of cases) of the cold remedy
X₁ = Cascade's quarterly advertising (x $1,000) for the cold remedy
X₂= competitors' advertising for similar products (x $10,000)
Here is additional information concerning the regression model:
8b1 = 0.052, 862 = 0.080, R² = 0.640, 8e-1.63, F-statistic=31.402, and Durbin-Watson (d) statistic=0.499.
Which of the independent variables (if any) appears to be statistically significant (at the 0.05 level) in explaining sales of the
remedy? (Hint: to.05/2,33-32.042.) Check all that apply.
□ X₁
OX2
What proportion of the total variation in sales is explained by the regression equation?
0.640
0.080
O 0.132
O 0.052
The given F-value shows that you
reject the null hypothesis that neither of the independent variables explains a
significant (at the 0.05 level) proportion of the variation in income. (Hint: Fo.05,2,33-2-F3.316.)

Transcribed Image Text:where
Y = quarterly sales (in thousands of cases) of the cold remedy
X₁ Cascade's quarterly advertising (x $1,000) for the cold remedy
X2 competitors' advertising for similar products (x $10,000)
=
Here is additional information concerning the regression model:
$61 0.052, 862=0.080, R2 = 0.640, 8= 1.63, F-statistic 31.402, and Durbin-Watson (d) statistic = 0.499.
-
Which of the independent variables (if any) appears to be statistically significant (at the 0.05 level)'in explaining sales of the cold
remedy? (Hint: to.05/2,33-3 2.042.) Check all that apply.
O X₁
X₂
What proportion of the total variation in sales is explained by the regression equation?
O 0.640
O 0.080
O 0.132
0.052
reject the null hypothesis that neither of the independent variables explains a
The given F-value shows that you.
sinnificant fat the 0.05 level) proportion of the variation in income. (Hint: Fo.05,2,33-2- 3.316.)
Expert Solution
This question has been solved!
Explore an expertly crafted, step-by-step solution for a thorough understanding of key concepts.

This is a popular solution

Trending nowThis is a popular solution!

Step by stepSolved in 5 steps with 17 images

Knowledge Booster


Learn more about
Need a deep-dive on the concept behind this application? Look no further. Learn more about this topic, economics and related others by exploring similar questions and additional content below.Similar questions
- The measure of standard error can also be applied to the parameter estimates resulting from linear regressions. For example, consider the following linear regression equation that describes the relationship between education and wage: WAGE: = Bo + B₁ EDUC; + &i where WAGE; is the hourly wage of person i (i.e., any specific person) and EDUC; is the number of years of education for that same person. The residual ₂ encompasses other factors that influence wage, and is assumed to be uncorrelated with education and have a mean of zero. Suppose that after collecting a cross-sectional data set, you run an OLS regression to obtain the following parameter estimates: WAGE;= -10.7+ 3.1 EDUC; If the standard error of the estimate of B₁ is 1.04, then the true value of B₁ lies between grows, you would expect this range to in size. and . As the number of observations in a data setarrow_forwardThe data for this question is given in the file 1.Q1.xlsx(see image) and it refers to data for some cities X1 = total overall reported crime rate per 1 million residents X3 = annual police funding in $/resident X7 = % of people 25 years+ with at least 4 years of college (a) Estimate a regression with X1 as the dependent variable and X3 and X7 as the independent variables. (b) Will additional education help to reduce total overall crime (lead to a statistically significant reduction in crime)? Please explain. (c) Will an increase in funding for the police departments help reduce total overall crime (lead to a statistically significant reduction in total overall crime)? Please explain. (d) If you were asked to recommend a policy to reduce crime, then, based only on the above regression results, would you choose to invest in education (local schools) or in additional funding for the police? Please explain.arrow_forwardThe data below represent commute times (in minutes) and scores on a well-being survey. Complete parts (a) through (d) below. Commute Time (minutes), x Well-Being Index Score, y 5 72 105 20 25 35 60 69.2 68.0 67.5 67.1 65.9 66.0 63.8 (a) Find the least-squares regression line treating the commute time, x, as the explanatory variable and the index score, y, as the response variable. ŷ=x+ (Round to three decimal places as needed.) (b) Interpret the slope and y-intercept, if appropriate. First interpret the slope. Select the correct choice below and, if necessary, fill in the answer box to complete your choice. OA. For every unit increase in commute time, the index score falls by (Round to three decimal places as needed.) OB. For every unit increase in index score, the commute time falls by (Round to three decimal places as needed.) 1 D. For an index score of zero, the commute time is predicted to be (Round to three decimal places as needed.) on average. on average. OC. For a commute time…arrow_forward
- An example of a cubic regression model is Yi= 30 + B1X + 32x2 + 33x³ + ui Yi = 30 + B1X + 32x² + ui. Yi = 30 + ß1ln(X) + ui Yi= 30 + 31X + B2Y2 + ui.arrow_forwardGeneral Cereals is using a regression model to estimate the demand for Tweetie Sweeties, a whistle-shaped, sugar-coated breakfast cereal for children. The following (multiplicative exponential) demand function is being used: QD= 6,280 P 1.35) 42.05 N 2.70 where QD quantity demanded, in 10-oz boxes P = price per box, in dollars A = advertising expenditures on daytime television, in dollars N = proportion of the population under 12 years old, in percent What is the point price elasticity of demand for Tweetie Sweeties? O 2.70 O 2.05 -0.66 -1.35 What is the advertising elasticity of demand? -1.35 O 2.70 O 0.76 O 2.05 According to the estimated model, a percent increase in the proportion of the population under 12 years old by percent. the quantity demandedarrow_forwardGiven the estimated multiple regression equation ŷ = 6 + 5x1 + 4x2 + 7x3 + 8x4 what is the predicted value of Y in each case? a. x1 = 10, x2 = 23, x3 = 9, and x4 = 12 b. x1 = 23, x2 = 18, x3 = 10, and x4 = 11 c. x1 = 10, x2 = 23, x3 = 9, and x4 = 12 d. x1 = -10, x2 = 13, x3 = -8, and x4 = -16arrow_forward
- General Cereals is using a regression model to estimate the demand for Tweetie Sweeties, a whistle-shaped, sugar-coated breakfast cereal for children. The following (multiplicative exponential) demand function is being used: QD = 6,280 P(-2.15) A1.75N2.70 where QD = quantity demanded, in 10-oz boxes P = price per box, in dollars A = advertising expenditures on daytime television, in dollars N = proportion of the population under 12 years old, in percent What is the point price elasticity of demand for Tweetie Sweeties? 1.75 -1.23 2.70 -2.15 What is the advertising elasticity of demand? 0.65 1.75 -2.15 2.70 According to the estimated model, a percent increase in the proportion of the population under 12 years old by percent. the quantity demandedarrow_forwardA finance manager employed by an automobile dealership believes that the number of cars sold in his local market can be predicted by the interest rate charged for a loan. Interest Rate (%) Number of Cars Sold (100s) 3 5 10 7 8 2 The finance manager performed a regression analysis of the number of cars sold and interest rates using the sample of data above. Shown below is a portion of the regression output. Regression Statistics Multiple R0.998868 R2 0.997738 Coefficient |14.88462 Interest Rate -1.61538 Intercept 1. Are there factors other than interest rate charged for a loan that the finance manager should consider in predicting future car sales? 2. Is interest rate charged for a loan the most important factor to be considered in predicting future car sales? Explain your reasoning.The dealership's vice- president of marketing has requested a sales forecast at the prevailing interest rate of 7%. 3. As finance manager, what reasons would you convey to the vice-president in recommending…arrow_forwardA researcher wants to test the relationship between the number of years of formal education received (X) and the average weekly earnings (Y) (measured in hundred dollars). A report released by a government agency suggests that the average weekly earnings of individuals with no formal education is equal to $545. The researcher wants to test whether the average weekly earnings with no formal education is $545 or greater than that. He collects data from a sample of 120 individuals and estimates the following regression function: Y-6.91+2.30X, (1.25) (4.25) where , is the predicted value of the weekly earnings for the individual and the standard errors for the coefficients appear in parenthesis. The f-statistic for the test the researcher wants to conduct will be (Round your answer to two decimal places)arrow_forward
- A home appraisal company would like to develop a regression model that would predict the selling price of a house based on the age of the house in years (X1), the living area of the house in square feet (X2), and the number of bedrooms (X3). The following regression model was chosen using a data set of house statistics: y=88,399554791.3333x231,471.1372x3 The first house from the data set had the following values: Selling price $324,000 Age - 22 years Square Feet 2.000 Bedrooms 3 The residual for this house is 23,558 -41,480 10,216 -16,095 27arrow_forwardRQ7. A teacher is trying to predict student test grades (Q). She believes test grades are a function of incoming GPA, hours studying, and hours spent on social media (a distraction). She runs a regression and it produces these coefficients: Variable Coefficient Intercept GPA Hours Studying Social Media 70.0 3.5 2.4 -4.0 For a given student Julian, his GPA is 2.0, he studies 4 hours for the exam, and he spends 6 hours on Facebook. Predict his exam score (round to the nearest whole number).arrow_forwardFind the degrees of freedom in a regression model that has 10 observations and 7 independent variablesarrow_forward
arrow_back_ios
SEE MORE QUESTIONS
arrow_forward_ios
Recommended textbooks for you
 Principles of Economics (12th Edition)EconomicsISBN:9780134078779Author:Karl E. Case, Ray C. Fair, Sharon E. OsterPublisher:PEARSON
 Engineering Economy (17th Edition)EconomicsISBN:9780134870069Author:William G. Sullivan, Elin M. Wicks, C. Patrick KoellingPublisher:PEARSON
 Principles of Economics (MindTap Course List)EconomicsISBN:9781305585126Author:N. Gregory MankiwPublisher:Cengage Learning
 Managerial Economics: A Problem Solving ApproachEconomicsISBN:9781337106665Author:Luke M. Froeb, Brian T. McCann, Michael R. Ward, Mike ShorPublisher:Cengage Learning
 Managerial Economics & Business Strategy (Mcgraw-...EconomicsISBN:9781259290619Author:Michael Baye, Jeff PrincePublisher:McGraw-Hill Education
Principles of Economics (12th Edition)
Economics
ISBN:9780134078779
Author:Karl E. Case, Ray C. Fair, Sharon E. Oster
Publisher:PEARSON
Engineering Economy (17th Edition)
Economics
ISBN:9780134870069
Author:William G. Sullivan, Elin M. Wicks, C. Patrick Koelling
Publisher:PEARSON
Principles of Economics (MindTap Course List)
Economics
ISBN:9781305585126
Author:N. Gregory Mankiw
Publisher:Cengage Learning
Managerial Economics: A Problem Solving Approach
Economics
ISBN:9781337106665
Author:Luke M. Froeb, Brian T. McCann, Michael R. Ward, Mike Shor
Publisher:Cengage Learning
Managerial Economics & Business Strategy (Mcgraw-...
Economics
ISBN:9781259290619
Author:Michael Baye, Jeff Prince
Publisher:McGraw-Hill Education