Write out your answers to questions in complete sentences. Include all relevant R code and output, without anything extraneous. Instead of importing in an external.csv dataset to analyze, we'll use a dataset that exists in an R package for this problem. Follow these steps to import the necessary dataset: Run this code to open the "car" package, which contains the dataset: > library(car) > my_eid <- Wong 3. The Wong dataset contains data from a study by Wong, Monette, and Weiner (2001) on sample of patients who fell into comas after sustaining traumatic brain injuries. After waking, Wong and colleagues administered various intelligence tests. The "duration" variable records how many days each patient was in a coma. You want to see if there is a change in performance IQ scores ("piq") as duration increased. a. Make a scatterplot for this analysis. Why is a linear regression not appropriate? b. Create a new variable in the data frame called "log_duration" that is the natural log of each duration value plus 1 (so that duration values of zero are defined). You may use the code template below, changing the "UPDATE" portions as needed > UPDATE <- log(UPDATE + 1) c. Assuming this data is a random sample of the population and the observations are independent, conduct an analysis to see if log-duration can predict piq.
Write out your answers to questions in complete sentences. Include all relevant R code and output, without anything extraneous. Instead of importing in an external.csv dataset to analyze, we'll use a dataset that exists in an R package for this problem. Follow these steps to import the necessary dataset: Run this code to open the "car" package, which contains the dataset: > library(car) > my_eid <- Wong 3. The Wong dataset contains data from a study by Wong, Monette, and Weiner (2001) on sample of patients who fell into comas after sustaining traumatic brain injuries. After waking, Wong and colleagues administered various intelligence tests. The "duration" variable records how many days each patient was in a coma. You want to see if there is a change in performance IQ scores ("piq") as duration increased. a. Make a scatterplot for this analysis. Why is a linear regression not appropriate? b. Create a new variable in the data frame called "log_duration" that is the natural log of each duration value plus 1 (so that duration values of zero are defined). You may use the code template below, changing the "UPDATE" portions as needed > UPDATE <- log(UPDATE + 1) c. Assuming this data is a random sample of the population and the observations are independent, conduct an analysis to see if log-duration can predict piq.

Glencoe Algebra 1, Student Edition, 9780079039897, 0079039898, 2018
18th Edition
ISBN:9780079039897
Author:Carter
Publisher:Carter
Chapter10: Statistics
Section10.1: Measures Of Center
Problem 25PFA

Related questions
Question
100%
Helppppppp::/$;$;&(&(&(&;&;&;&&&;&;&(&(&;&;&(&(&(&;@;&((&;:&:@(&(&;&@;
Transcribed Image Text:●
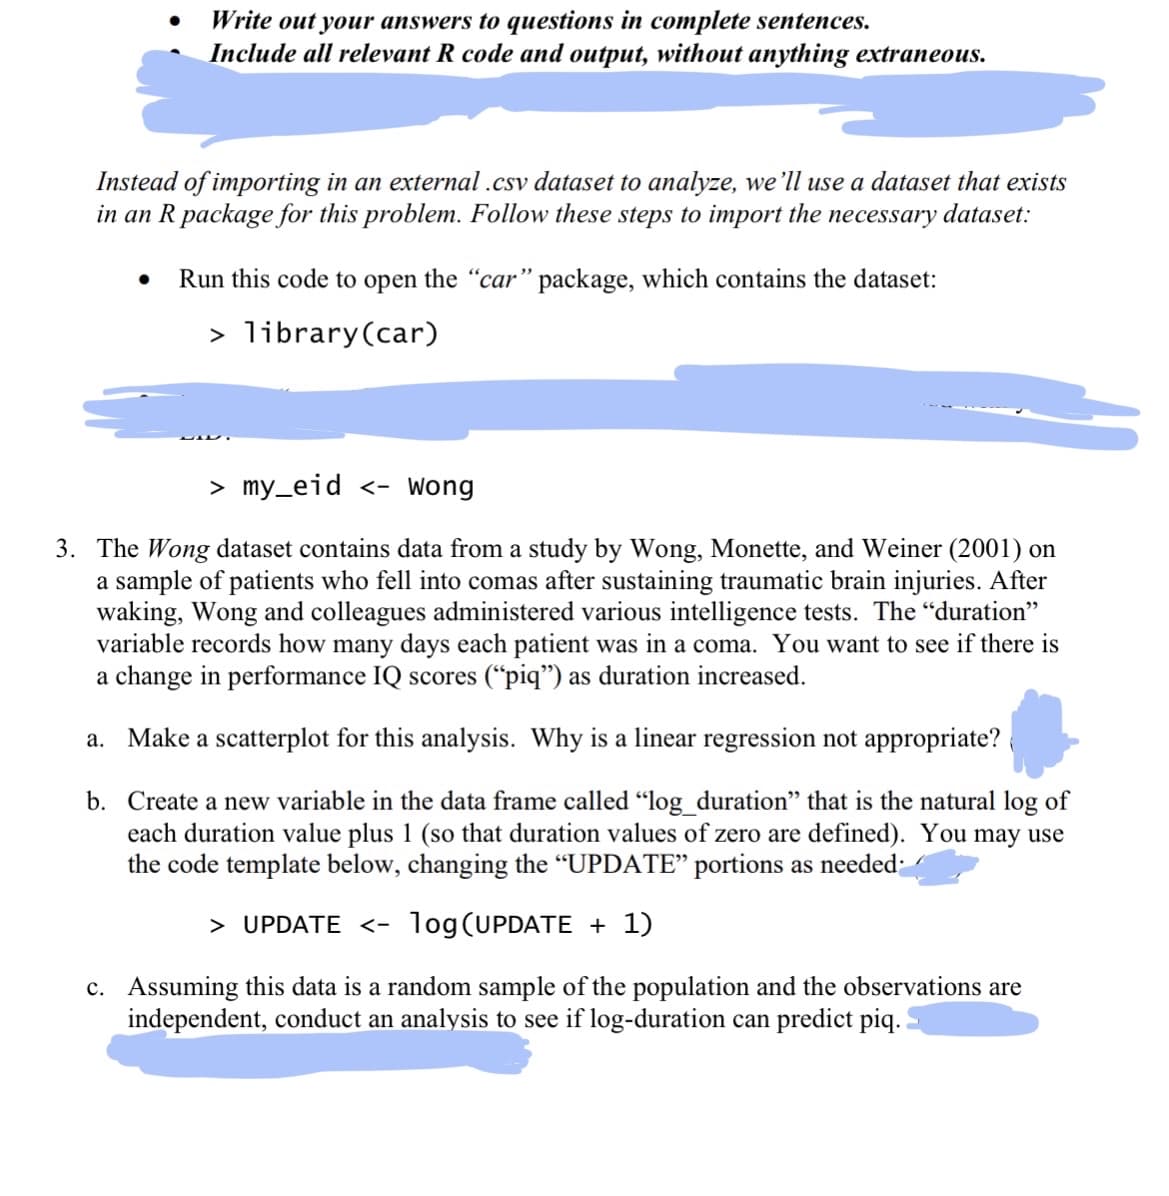
Write out your answers to questions in complete sentences.
Include all relevant R code and output, without anything extraneous.
Instead of importing in an external .csv dataset to analyze, we'll use a dataset that exists
in an R package for this problem. Follow these steps to import the necessary dataset:
● Run this code to open the "car" package, which contains the dataset:
> library (car)
> my_eid <- Wong
3. The Wong dataset contains data from a study by Wong, Monette, and Weiner (2001) on
a sample of patients who fell into comas after sustaining traumatic brain injuries. After
waking, Wong and colleagues administered various intelligence tests. The "duration"
variable records how many days each patient was in a coma. You want to see if there is
a change in performance IQ scores ("piq") as duration increased.
a. Make a scatterplot for this analysis. Why is a linear regression not appropriate?
b. Create a new variable in the data frame called "log_duration" that is the natural log of
each duration value plus 1 (so that duration values of zero are defined). You may use
the code template below, changing the "UPDATE" portions as needed.
> UPDATE <- log(UPDATE + 1)
c. Assuming this data is a random sample of the population and the observations are
independent, conduct an analysis to see if log-duration can predict piq.
Expert Solution
This question has been solved!
Explore an expertly crafted, step-by-step solution for a thorough understanding of key concepts.

This is a popular solution!

Trending now
This is a popular solution!

Step by step
Solved in 5 steps with 4 images

Recommended textbooks for you
Glencoe Algebra 1, Student Edition, 9780079039897…
Algebra
ISBN:
9780079039897
Author:
Carter
Publisher:
McGraw Hill

Holt Mcdougal Larson Pre-algebra: Student Edition…
Algebra
ISBN:
9780547587776
Author:
HOLT MCDOUGAL
Publisher:
HOLT MCDOUGAL

Big Ideas Math A Bridge To Success Algebra 1: Stu…
Algebra
ISBN:
9781680331141
Author:
HOUGHTON MIFFLIN HARCOURT
Publisher:
Houghton Mifflin Harcourt
Glencoe Algebra 1, Student Edition, 9780079039897…
Algebra
ISBN:
9780079039897
Author:
Carter
Publisher:
McGraw Hill
Holt Mcdougal Larson Pre-algebra: Student Edition…
Algebra
ISBN:
9780547587776
Author:
HOLT MCDOUGAL
Publisher:
HOLT MCDOUGAL
Big Ideas Math A Bridge To Success Algebra 1: Stu…
Algebra
ISBN:
9781680331141
Author:
HOUGHTON MIFFLIN HARCOURT
Publisher:
Houghton Mifflin Harcourt

Elementary Geometry For College Students, 7e
Geometry
ISBN:
9781337614085
Author:
Alexander, Daniel C.; Koeberlein, Geralyn M.
Publisher:
Cengage,