
MATLAB: An Introduction with Applications
6th Edition
ISBN: 9781119256830
Author: Amos Gilat
Publisher: John Wiley & Sons Inc
expand_more
expand_more
format_list_bulleted
Related questions
Question
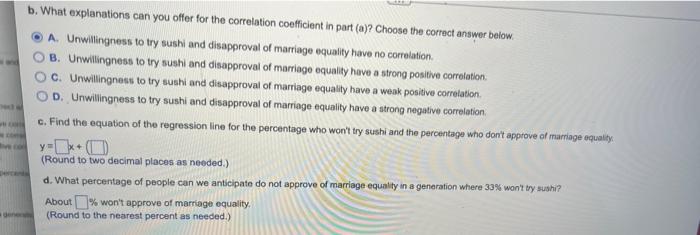

Transcribed Image Text:b. What explanations can you offer for the correlation coefficient in part (a)? Choose the correct answer below.
A. Unwillingness to try sushi and disapproval of marriage equality have no correlation.
B. Unwillingness to try sushi and disapproval of marriage equality have a strong positive correlation.
C. Unwillingness to try sushi and disapproval of marriage equality have a weak positive correlation.
wnd
D. Unwillingness to try sushi and disapproval of marriage equality have a strong negative correlation.
c. Find the equation of the regression line for the percentage who won't try sushi and the percentage who don't approve of marriage equality
y=+ (O
(Round to two decimal places as needed.)
Bive co
d. What percentage of people can we anticipate do not approve of marriage equality in a generation where 33% won't try sushi?
About % won't approve of marriage equality.
(Round to the nearest percent as needed.)

Transcribed Image Text:Use the data to the right to complete
parts (a) through (4) below.
Percentage Who
Won't Try Don't Approve of
Sushi Marriage Equality
Generation
Millennials
Gen X
Boomers
SilentGreatest
Generation
42
38
55
49
63
53
74
65
a. Determine the corelation coeficient betwoen the percentage of people who won't try sushi and the percentage who do not approve of marrage equality.
(Do not round unti the finai anower. Then round to two decimal places as needed.)
b. What explanations can you offer for the correlation coeficient in part (a)? Choose the corect answer below.
OA Unwilingness to try sushi and disapproval of marriage equality have no correlation.
OB. Unwillingness to try sushi and disapproval of marriage equality have a strong positive correlation.
C. Urwillingness to try sushi and disapproval of mamiage equality have a weak postive corelation
OD. Unwillingness to try sushi and disapproval of marrage equality have a strong negative corelation
wnd
e. Find the equation of the regression line for the percentage who won't try sushi and the percentage who dont approve of marriage equality
(Round to two decimal places as needed.)
Expert Solution
This question has been solved!
Explore an expertly crafted, step-by-step solution for a thorough understanding of key concepts.

This is a popular solution

Trending nowThis is a popular solution!

Step by stepSolved in 2 steps

Knowledge Booster

Similar questions
- 3 5 y = f(x) 1.732 2.236 2.645 3.316 Use inverse interpolation to find the value of x for y=3 constructing divided differences table for the data given above.arrow_forwardWith what type of data (scale of measurement) might you apply Chi Square? Describe Chi Square and give an example of when you might use the Chi Square test.arrow_forwardMSC 600 Quantitative Methods 7. Part of an ANOVA table is shown below. Source of Variation Between Treatments Within Treatments (Error) TOTAL 480 18 The mean square due to treatments (MSTR) is a. 20. b. 60. c. 18. d. 15. ANSWER: b 1105 words 8. Part of an ANOVA table is shown below. Source of +Sum of Variation "Squares Between Treatments 180 Within Treatments (Error) TOTAL Sum of Degrees of SquaresFreedom 3 480 c. 18. d. 20. ANSWER: d 180 The mean square due to error (MSE) is a. 60. b. 15. N Text Predictions: On Degrees of Freedom 3 18 Mean Square Mean Square Focus F 80 F um O Search COLLEGE OF BUSINESSarrow_forward
- Data of variable-A is collected as shown to the right. Is the mean of Variable-A less than 80? State null hypothesis and choose level of significance, a = 0.05. (Use Excel ttest function, provide clear logic and reasoning.) Variable-A Variable-B 78.8 81.9 76.9 78.0 67.8 69.7 68.9 74.7 70.5 70.0 80.0 68.2 63.0 88.7 78.7 86.7 85.4 69.5 87.0 75.1 82.4 71.8 78.2 58.1 76.9 74.8 60.2 93.2 82.6 84.6 67.2 66.5 71.7 77.2 68.9 74.0 69.3 77.7 89.1 78.6 76.3 68.3 74.0 89.0 69.4 82.1 76.3 78.0 66.2 80.3 73.9 82.4 79.1 83.1 80.4 66.4 66.2 67.6 80.9 75.3arrow_forwardI need working for this to double check.arrow_forwardCan you please check my workarrow_forward
- K L Marrow_forwardare you able to help me produce a graph which includes all of this Use the data generated in the laboratory to prepare a table and graph of the results, with a written summary. To include: Table of summary results that is mean and SD (standard deviation) only (not individual numbers for each tube) Graph of change in whatever parameter (plot the mean and error bar using the standard deviation) is used to determine the effect on the vegetable on the y-axis against sugar/NaCl concentration on x-axis, put both parameters on one graph. Do a correlation graph so add a correlation, R2 number, find this in Excel – add trendline and under trendline look for more options and at bottom at R2 to graph. Then in discussion use this value to comment on whether or not a correlation between the changes and the findings. Text: short summary of the key findings - NOT what happens for each tube but the general trend of the results and the correlation coefficient. with these set of results Solution…arrow_forwardPLEASE ANSWER ALL THE PARTS OF THE QUESTION (THIS IS NOT A HRADED ASSIGNMENT)arrow_forward
arrow_back_ios
arrow_forward_ios
Recommended textbooks for you
- MATLAB: An Introduction with ApplicationsStatisticsISBN:9781119256830Author:Amos GilatPublisher:John Wiley & Sons Inc
 Probability and Statistics for Engineering and th...StatisticsISBN:9781305251809Author:Jay L. DevorePublisher:Cengage Learning
 Statistics for The Behavioral Sciences (MindTap C...StatisticsISBN:9781305504912Author:Frederick J Gravetter, Larry B. WallnauPublisher:Cengage Learning
  Elementary Statistics: Picturing the World (7th E...StatisticsISBN:9780134683416Author:Ron Larson, Betsy FarberPublisher:PEARSON
 The Basic Practice of StatisticsStatisticsISBN:9781319042578Author:David S. Moore, William I. Notz, Michael A. FlignerPublisher:W. H. Freeman
 Introduction to the Practice of StatisticsStatisticsISBN:9781319013387Author:David S. Moore, George P. McCabe, Bruce A. CraigPublisher:W. H. Freeman
MATLAB: An Introduction with Applications
Statistics
ISBN:9781119256830
Author:Amos Gilat
Publisher:John Wiley & Sons Inc
Probability and Statistics for Engineering and th...
Statistics
ISBN:9781305251809
Author:Jay L. Devore
Publisher:Cengage Learning
Statistics for The Behavioral Sciences (MindTap C...
Statistics
ISBN:9781305504912
Author:Frederick J Gravetter, Larry B. Wallnau
Publisher:Cengage Learning
Elementary Statistics: Picturing the World (7th E...
Statistics
ISBN:9780134683416
Author:Ron Larson, Betsy Farber
Publisher:PEARSON
The Basic Practice of Statistics
Statistics
ISBN:9781319042578
Author:David S. Moore, William I. Notz, Michael A. Fligner
Publisher:W. H. Freeman
Introduction to the Practice of Statistics
Statistics
ISBN:9781319013387
Author:David S. Moore, George P. McCabe, Bruce A. Craig
Publisher:W. H. Freeman