MATLAB: An Introduction with Applications
6th Edition
ISBN: 9781119256830
Author: Amos Gilat
Publisher: John Wiley & Sons Inc
expand_more
expand_more
format_list_bulleted
Topic Video
Question

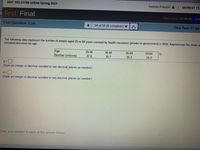
Transcribed Image Text:MAT 103-21766 online Spring 2021
Yasmin Priester &| 05/09/21 11:
Test: Final
Time Limit: 03:00:00
Sub
This Question: 2 pts
14 of 15 (5 complete)
This Test: 47 pts
The following data represent the number of people aged 25 to 64 years covered by health insurance (private or government) in 2018. Approximate the mean a
standard deviation for age.
Age
Number (millions)
25-34
35-44
45-54
55-64
22.6
35.7
35.3
25.3
(Type an integer or decimal rounded to two decimal places as needed.)
(Type an integer or decimal rounded to two decimal places as needed.)
Enter your answer in each of the answer boxes.
Expert Solution
This question has been solved!
Explore an expertly crafted, step-by-step solution for a thorough understanding of key concepts.
This is a popular solution
Trending nowThis is a popular solution!
Step by stepSolved in 2 steps with 2 images

Knowledge Booster
Learn more about
Need a deep-dive on the concept behind this application? Look no further. Learn more about this topic, statistics and related others by exploring similar questions and additional content below.Similar questions
- The list below shows the ages (in years) of 11 people riding in a van to a math competition. Calculate the mean age of the people in the van. Round your answer to the nearest tenth of a year. ages 14 11 10 11 15 13 12 14 10 11 37 Mean = years (Please round your answer to the nearest tenth.) Median = years (Please enter an exact answer.)arrow_forwardThe following data represent the number of people aged 25 to 64 years covered by health insurance (private or government) in 2018. Approximate the mean and standard deviation for age. Age Number (millions) 25-34 22.6 μ= (Type an integer or decimal rounded to two decimal places as needed.) 35-44 36.7 www 45-54 35.6 55-64 22.3arrow_forwardThe sample mean amount of savings is $arrow_forward
- What is the standard deviation?arrow_forwardThe top 14 speeds, in miles per hour, for Pro-Stock drag racing over the past two decades are listed below. Find the mean speed 191.3 181.1 202.2 190.1 201.4 201.4 192.2 201.2 193.2 201.2 194.5 199.2 196.0 196.2 O A. 196.1 O B. 181.1 O C. 202.2 Question Viewer O D. 195.8arrow_forwardThe mean age of two people in a room is 20 years. A 50 year old person enters the room. What is the mean age of the 3 people in the room now 20 30 33.3 35 none of the abovearrow_forward
- Identify the statistic that is used to estimate a. a population mean.b. a population standard deviation.arrow_forwardThe age of student at a university are normally distributed with a mean of 20. What percentage of the student body is at least 20 years old?arrow_forwardFind the mean and standard deviation of the following numbers: 35,18,12,32,35,75,32,26,18arrow_forward
- A survey is conducted on 700 Californians older than 30 years of age. The study wants to obtain inference on the relationship between years of education and yearly income in dollars. The response variable is income in dollars and the explanatory variable is years of education. A simple linear regression model is fit, and the output from R is below: Im(formula = Income ~ Education, data = CA) Coefficients: Estimate Std. Error t value Pr(>|t|) (Intercept) 25200.25 1488.94 16.93 3.08e-10 *** Education 2905.35 112.61 25.80 1.49e-12 *** Residual standard error: 32400 on 698 degrees of freedom Multiple R-squared: 0.7602arrow_forwardA retail survey asked college students how much they planned to spend in various categories during the upcoming academic year. One category is the amount students planned to spend on school supplies. The data below show the amount of money students planned to spend on school supplies. 58, 60, 67, 69, 70, 73, 74, 77, 78, 80, 83, 84, 87, 89, 94, 96, 97, 100, 102, 105 USE SALT (a) Calculate the mean and median for the distribution of money students planned to spend on school supplies. mean median (b) What is the 75th percentile of the distribution? (c) Determine the five-number summary. minimum Q₁ median Q3 maximumarrow_forwardConsider the following data of 10 exams scores: 28, 57, 58, 64, 69, 74, 79, 80, 83, 85 1. The the mean, median, and mode 2. find the standard deviation without a graphing calculator. Show all your computationsarrow_forward
arrow_back_ios
SEE MORE QUESTIONS
arrow_forward_ios
Recommended textbooks for you
 MATLAB: An Introduction with ApplicationsStatisticsISBN:9781119256830Author:Amos GilatPublisher:John Wiley & Sons Inc
 Probability and Statistics for Engineering and th...StatisticsISBN:9781305251809Author:Jay L. DevorePublisher:Cengage Learning
 Statistics for The Behavioral Sciences (MindTap C...StatisticsISBN:9781305504912Author:Frederick J Gravetter, Larry B. WallnauPublisher:Cengage Learning
 Elementary Statistics: Picturing the World (7th E...StatisticsISBN:9780134683416Author:Ron Larson, Betsy FarberPublisher:PEARSON
 The Basic Practice of StatisticsStatisticsISBN:9781319042578Author:David S. Moore, William I. Notz, Michael A. FlignerPublisher:W. H. Freeman
 Introduction to the Practice of StatisticsStatisticsISBN:9781319013387Author:David S. Moore, George P. McCabe, Bruce A. CraigPublisher:W. H. Freeman

MATLAB: An Introduction with Applications
Statistics
ISBN:9781119256830
Author:Amos Gilat
Publisher:John Wiley & Sons Inc

Probability and Statistics for Engineering and th...
Statistics
ISBN:9781305251809
Author:Jay L. Devore
Publisher:Cengage Learning

Statistics for The Behavioral Sciences (MindTap C...
Statistics
ISBN:9781305504912
Author:Frederick J Gravetter, Larry B. Wallnau
Publisher:Cengage Learning

Elementary Statistics: Picturing the World (7th E...
Statistics
ISBN:9780134683416
Author:Ron Larson, Betsy Farber
Publisher:PEARSON

The Basic Practice of Statistics
Statistics
ISBN:9781319042578
Author:David S. Moore, William I. Notz, Michael A. Fligner
Publisher:W. H. Freeman

Introduction to the Practice of Statistics
Statistics
ISBN:9781319013387
Author:David S. Moore, George P. McCabe, Bruce A. Craig
Publisher:W. H. Freeman