ENGR.ECONOMIC ANALYSIS
14th Edition
ISBN: 9780190931919
Author: NEWNAN
Publisher: Oxford University Press
expand_more
expand_more
format_list_bulleted
Concept explainers
Question
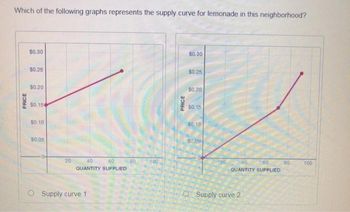
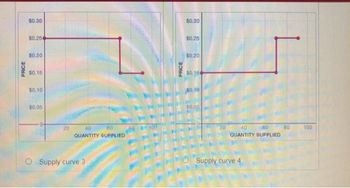
Two children living in a neighborhood have decided to go into business running lemonade stands. Annie has spent$10on a pitcher to make the lemonade in, and can produce up to 70 cups of lemonade per day. She spends$0.15per cup of lemonade on lemons, sugar, and plastic cups. Bobby has spent$1on a pitcher, and can produce only 20 cups of lemonade per day. He spends$0.25per cup of lemonade on lemons, sugar, and plastic cups. Which of the following graphs represents the supply curve for lemonade in this neighborhood?
Note:-
- Do not provide handwritten solution. Maintain accuracy and quality in your answer. Take care of plagiarism.
- Answer completely.
- You will get up vote for sure.

Transcribed Image Text:Which of the following graphs represents the supply curve for lemonade in this neighborhood?
PRICE
$0.30
$0.25
$0.20
$0.15
$0.10
$0.05
20
40
60
QUANTITY SUPPLIED
Supply curve 1
60
100
PRICE
$0.30
$0.25
$0.20
$0.15
sobs
60
QUANTITY SUPPLIED
Supply curve 2
80
100

Transcribed Image Text:PRICE
$0.30
$0.25
$0.20
$0.15
$0.10
$0.05
20
60
40
QUANTITY SUPPLIED
O Supply curve 3
PRICE
$0,30
$0.25
$0.20
$0,154
$0.
10
40
60
QUANTITY SUPPLIED
Supply curve 4
80
100
Expert Solution
This question has been solved!
Explore an expertly crafted, step-by-step solution for a thorough understanding of key concepts.
This is a popular solution
Trending nowThis is a popular solution!
Step by stepSolved in 3 steps

Knowledge Booster
Learn more about
Need a deep-dive on the concept behind this application? Look no further. Learn more about this topic, economics and related others by exploring similar questions and additional content below.Similar questions
- Only typed answerarrow_forward10. Read this excerpt from the October 18, 2022, Wall Street Journal. KINDERHOOK, N.Y.—Golden Harvest Farms has grown from a small apple-growing operation when Doug Grout’s grandfather opened it after World War II, to a multipronged business that includes a retail stand, cider press, distillery, tasting room and barbecue restaurant. But Mr. Grout said he sees a cloudier future for the business due to new state regulations that will require him to increasingly pay more overtime to the farmworkers who pick his apples in the coming years, raising one of his primary costs. “We were looking to buy another orchard, and that whole thing is tabled,” said Mr. Grout, 52 years old, who co-owns Golden Harvest with his father, as he drove between rows of Honeycrisp trees. “We’re stepping away. You’re going to see farms go out of business. This is very shortsighted.” For the apple market in New York, the new regulations will: Cause supply to shift to the left, leading to higher prices and a…arrow_forward11. Calculating %age Exx *3* When the price of product "X" increases 15 percent (+15%), the quantity demanded of "X" decreases 12 percent (-12%). The price elasticity of demand for "X" is: O "-1.25" and the demand for "X" is "relatively inelastic." "-1.25" and the demand for "X" is "relatively elastic." O "-1.25" and "X" is a "normal" good. O "-0.80" and the demand for "X" is "relatively elastic." O "-0.80" and the demand for "X" is "relatively inelastic." Save & Continue Continue without savingarrow_forward
- Please explain how to graph this. From the curve of the demand and supply and the factors that affects the grapharrow_forwardProfit is the incentive that drives our market economy. Firms make production, pricing, andhiring decisions based on their quest for profit. But what happens when a firm discoversthat it can make dramatically higher profits by stopping production altogether? In December2000, due to wild swings in the market for electricity, Kaiser Aluminium faced just such adecision.Kaiser Aluminium had contracted with Bonneville power for all of its electricity needs andfound itself in the unique position of being an electricity consumer and, potentially, anelectricity reseller. By December 2000, Kaiser faced a difficult decision of continuing itscurrent aluminium production and profit levels, or closing the plant to dramatically increaseits profit by simply reselling its electricity.When making production decisions, firms must consider both their costs and revenues. Oneimportant concern for many firms is utility costs. In 1996, Kaiser Aluminium Corporation inSpokane, Washington, entered into a…arrow_forwardQue 1arrow_forward
- Suppose the market for fresh pork is a competitive market. Initially, it is operatingat its long-run competitive equilibrium at a market price of $50.Owing to the spread of COVID-19, many people turn to buying frozen meat oncea week rather than fresh pork every day. As a result, the market price of fresh porkreduces to $30.a. With the aid of a pair of market-and-firm diagrams, illustrate how thiswould affect the equilibrium price and quantity in the fresh pork market andthe output of a typical butcher of fresh pork in the short-run.b. Suppose, for the situation in (a), the average cost of a typical butcher offresh pork is $40, which includes $15 on buying meat from suppliers, $12on paying rent, $8 on paying hourly wages on staff, and $5 on other costs.Explain whether a typical butcher should shut down in the short run.arrow_forward3. Profit maximization using total cost and total revenue curves Suppose Bob runs a small business that manufactures teddy bears. Assume that the market for teddy bears is a competitive market, and the market price is $25 per teddy bear. The following graph shows Bob's total cost curve. Use the blue points (circle symbol) to plot total revenue and the green points (triangle symbol) to plot profit for teddy bears quantities zero through seven (inclusive) that Bob produces. TOTAL COST AND REVENUE (Dollars) 200 175 150 125 100 75 50 25 0 -25 O ☐ ☐ 0 1 2 3 4 5 QUANTITY (Teddy bears) ☐ 6 Total Cost 7 8 O Total Revenue Profit ?arrow_forwardHello, this is a microeconomics question. Please use a drawing of a relevant graph to explain how does perfect competition ensure allocative efficiency? Not sure if I'm supposed to use this graph, but if i am please use it as reference when making your explantion to the question of how does perfect competition ensure allocative efficiencyarrow_forward
- Discuss economies of scale and how average cost changes as output increases. What pricing strategy should a firm adopt while they are experiencing economies of scale? 250 words pleasearrow_forwarda donut shop charges customers the same price. the profit maximising output is 100 at a price of 5$ per donut. marginal cost is 2$. The donut shop owner now discovers that it has two very different types of customer children and adults . It can maximise its profits by selling 30 donuts to children for a price of 4$ per donut and 70 donuts per evening to everyone else for a price of 6$ per donut. Draw a diagram showing the profit-maximising price and output a) when all customers are charged the same price and b) when children are charged a different price c)How much profit does the donut shop owner make when children are charged a different price? explain how to draw the diagrams also in detail please!arrow_forwardWhat is an example of another business that stays open even when it's slow, and its revenue does not seem like it could cover its costs? Use microeconomics terms to explainarrow_forward
arrow_back_ios
SEE MORE QUESTIONS
arrow_forward_ios
Recommended textbooks for you

 Principles of Economics (12th Edition)EconomicsISBN:9780134078779Author:Karl E. Case, Ray C. Fair, Sharon E. OsterPublisher:PEARSON
 Engineering Economy (17th Edition)EconomicsISBN:9780134870069Author:William G. Sullivan, Elin M. Wicks, C. Patrick KoellingPublisher:PEARSON
 Principles of Economics (MindTap Course List)EconomicsISBN:9781305585126Author:N. Gregory MankiwPublisher:Cengage Learning
 Managerial Economics: A Problem Solving ApproachEconomicsISBN:9781337106665Author:Luke M. Froeb, Brian T. McCann, Michael R. Ward, Mike ShorPublisher:Cengage Learning
 Managerial Economics & Business Strategy (Mcgraw-...EconomicsISBN:9781259290619Author:Michael Baye, Jeff PrincePublisher:McGraw-Hill Education


Principles of Economics (12th Edition)
Economics
ISBN:9780134078779
Author:Karl E. Case, Ray C. Fair, Sharon E. Oster
Publisher:PEARSON

Engineering Economy (17th Edition)
Economics
ISBN:9780134870069
Author:William G. Sullivan, Elin M. Wicks, C. Patrick Koelling
Publisher:PEARSON

Principles of Economics (MindTap Course List)
Economics
ISBN:9781305585126
Author:N. Gregory Mankiw
Publisher:Cengage Learning

Managerial Economics: A Problem Solving Approach
Economics
ISBN:9781337106665
Author:Luke M. Froeb, Brian T. McCann, Michael R. Ward, Mike Shor
Publisher:Cengage Learning

Managerial Economics & Business Strategy (Mcgraw-...
Economics
ISBN:9781259290619
Author:Michael Baye, Jeff Prince
Publisher:McGraw-Hill Education