
MATLAB: An Introduction with Applications
6th Edition
ISBN: 9781119256830
Author: Amos Gilat
Publisher: John Wiley & Sons Inc
expand_more
expand_more
format_list_bulleted
Related questions
Question
Which of the following is the equation of the relationship between the predictor variable (x) and the response variable (y)?
A y = 25.707 + 0.9887x
B y = 29.796 + 0.5897x
C y = 25.707 + 0.5897x
D y = 29.796 + 0.9887x
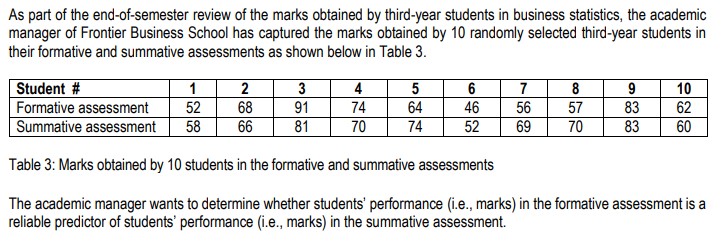

Transcribed Image Text:As part of the end-of-semester review of the marks obtained by third-year students in business statistics, the academic
manager of Frontier Business School has captured the marks obtained by 10 randomly selected third-year students in
their formative and summative assessments as shown below in Table 3.
1
2
52
68
58 66
3
91
81
Student #
Formative assessment
Summative assessment
Table 3: Marks obtained by 10 students in the formative and summative assessments
The academic manager wants to determine whether students' performance (i.e., marks) in the formative assessment is a
reliable predictor of students' performance (i.e., marks) in the summative assessment.
4
74
70
5
64
74
6
46
52
7
8
56 57
69
70
9
83
83
1860
62
Expert Solution
This question has been solved!
Explore an expertly crafted, step-by-step solution for a thorough understanding of key concepts.

Step by stepSolved in 3 steps with 3 images

Knowledge Booster

Similar questions
- The following table was generated from the sample data of 1010 junior high students regarding the average number of hours they are unsupervised per night, the average number of hours they play video games per night, and their final grades in their math class. The dependent variable is the final grade, the first independent variable (x1x1) is the number of hours unsupervised each night, and the second independent variable (x2x2) is the number of hours of video games each night. Coefficients Standard Error t-Stat p-value Intercept 57.968435 7.227955 8.020032 0.000201 Hours Unsupervised 5.131630 1.314283 3.904510 0.007943 Hours Playing Video Games 1.067855 1.615039 0.661194 0.533040 Write the multiple regression equation for the computer output given. Round your answers to three decimal places.arrow_forwardB. What is the best predicted temperature for a time when a bug is chirping at the rate of 3000 chirps per minute? The best predicted temperature when a bug is chirping at 3000 chirps per minute is____°F. C. What is wrong with this predicted value? The first variable should have been the dependent variable. It is unrealistically high. The value 3000 is far outside of the range of observed values. It is only an approximation. An unrounded value would be considered accurate. Nothing is wrong with this value. It can be treated as an accurate prediction.arrow_forwardA scientist, who wants to study the effects of precipitation on rice crops, sets up an experiment with 4 groups of rice crops. Rice crop harvest vs. precipitation level Group B Group A 0 150 Group C Precipitation (cm/annually) Harvest (pounds/acre) 0 60 Which statement best describes the relationship between the dependent and independent variables in this study? 20 O The amount of precipitation is dependent on the amount of rice harvest. O The amount of rice harvest is positively correlated with the increase in precipitation. The amount of rice harvest is not affected by the amount of precipitation. The amount of rice harvest is negatively correlated with the increase in precipitation. 200 Group D 40 300arrow_forward
- A patient is classified as having gestational diabetes if their average glucose level is above 140 milligrams per deciliter (mg/dl) one hour after a sugary drink is ingested. Rebecca's doctor is concerned that she may suffer from gestational diabetes. There is variation both in the actual glucose level and in the blood test that measures the level. Rebecca's measured glucose level one hour after ingesting the sugary drink varies according to the Normal distribution with μ=140+5 mg/dl and σ=5+1 mg/dl. Using the Central Limit Theorem, determine the probability of Rebecca being diagnosed with gestational diabetes if her glucose level is measured: Once? n=5+2 times n=5+4 times Comment on the relationship between the probabilities observed in (a), (b), and (c). Explain, using concepts from lecture why this occurs and what it means in context.arrow_forwardYou work as a data scientist for a real estate company in a seaside resort town. Your boss has asked you to discover if it's possible to predict how much a home's distance from the water affects its selling price. You are going to collect a random sample of 7 recently sold homes in your town. You will note the distance each home is from the water (denoted by x, in km) and each home's selling price (denoted by y, in hundreds of thousands of dollars). You will also note the product x.y of the distance from the water and selling price for each home. (These products are written in the row labeled "xy"). (a) Click on "Take Sample" to see the results for your random sample. Distance from the water, .x (in km) Take Sample Selling price, y (in hundreds of thousands of dollars) xy Send data to calculator Based on the data from your sample, enter the indicated values in the column on the left below. Round decimal values to three decimal places. When you are done, select "Compute". (In the table…arrow_forwardThe following table was generated from the sample data of 10 junior high students regarding the average number of hours they are unsupervised per night, the average number of hours they play video games per night, and their final grades in their math class. The dependent variable is the final grade, the first independent variable (x1) is the number of hours unsupervised each night, and the second independent variable (x2) is the number of hours of video games each night. Coefficients Standard Error t-Stat p-value Intercept 62.711817 4.607133 13.611896 0.000010 Hours Unsupervised 0.635048 0.915495 0.693666 0.513836 Hours Playing Video Games 7.528738 1.296727 5.805955 0.001145 Copy Data Step 1 of 2: Write the multiple regression equation for the computer output given. Round your answers to three decimal places. Answer 田 Tables 国 Keypad How to enter your answer (opens in new window) Keyboard Shortcuts X +arrow_forward
- Pa.n.narrow_forwardA professor in a university is trying to conduct a research study. His study is trying to determine if his 8 am lecture is more interactive with him than his 2 pm lecture. What is the independent variable? How many levels are there for the independent variable? What is the dependent variable?arrow_forwardThe following table was generated from the sample data of 1010 junior high students regarding the average number of hours they are unsupervised per night, the average number of hours they play video games per night, and their final grades in their math class. The dependent variable is the final grade, the first independent variable (x1x1) is the number of hours unsupervised each night, and the second independent variable (x2x2) is the number of hours of video games each night. Coefficients Standard Error t-Stat p-value Intercept 57.968435 7.227955 8.020032 0.000201 Hours Unsupervised 5.131630 1.314283 3.904510 0.007943 Hours Playing Video Games 1.067855 1.615039 0.661194 0.533040 Indicate if any of the independent variables could be eliminated at thearrow_forward
- Which of the following sets of data represent valid functions? OR = {(– 5,0), (2, 3), (6, 4), (8, 9), (15, 14)} OG = {(– 5, – 3), (2, 1), (2, 4), (8, 7), (15, 13)} OS = {(– 5, – 4), (2, 3), (6, 5), (7, 9), (11, 16)} OF = {(– 4, – 1), (3, 2), (5, 4), ( – 4, – 1), (10, 15)} - - Question Help: DVideoarrow_forwarda. Estimate the regression line and also write the prediction equation. y = 83.4578-5.8795 x y = 5.8795 + 83.4578 x ŷ ŷ= = -5.8795 + 83.4578 x = 83.4578 + 5.8795 xarrow_forwardThe EPA records data on the fuel economy of many different makes of cars. They are interested in determining if one could predict the mileage of the car (in miles per gallon) from the weight of the car (in pounds). What is the response variable to this study?arrow_forward
arrow_back_ios
SEE MORE QUESTIONS
arrow_forward_ios
Recommended textbooks for you
- MATLAB: An Introduction with ApplicationsStatisticsISBN:9781119256830Author:Amos GilatPublisher:John Wiley & Sons Inc
 Probability and Statistics for Engineering and th...StatisticsISBN:9781305251809Author:Jay L. DevorePublisher:Cengage Learning
 Statistics for The Behavioral Sciences (MindTap C...StatisticsISBN:9781305504912Author:Frederick J Gravetter, Larry B. WallnauPublisher:Cengage Learning
  Elementary Statistics: Picturing the World (7th E...StatisticsISBN:9780134683416Author:Ron Larson, Betsy FarberPublisher:PEARSON
 The Basic Practice of StatisticsStatisticsISBN:9781319042578Author:David S. Moore, William I. Notz, Michael A. FlignerPublisher:W. H. Freeman
 Introduction to the Practice of StatisticsStatisticsISBN:9781319013387Author:David S. Moore, George P. McCabe, Bruce A. CraigPublisher:W. H. Freeman
MATLAB: An Introduction with Applications
Statistics
ISBN:9781119256830
Author:Amos Gilat
Publisher:John Wiley & Sons Inc
Probability and Statistics for Engineering and th...
Statistics
ISBN:9781305251809
Author:Jay L. Devore
Publisher:Cengage Learning
Statistics for The Behavioral Sciences (MindTap C...
Statistics
ISBN:9781305504912
Author:Frederick J Gravetter, Larry B. Wallnau
Publisher:Cengage Learning
Elementary Statistics: Picturing the World (7th E...
Statistics
ISBN:9780134683416
Author:Ron Larson, Betsy Farber
Publisher:PEARSON
The Basic Practice of Statistics
Statistics
ISBN:9781319042578
Author:David S. Moore, William I. Notz, Michael A. Fligner
Publisher:W. H. Freeman
Introduction to the Practice of Statistics
Statistics
ISBN:9781319013387
Author:David S. Moore, George P. McCabe, Bruce A. Craig
Publisher:W. H. Freeman