ENGR.ECONOMIC ANALYSIS
14th Edition
ISBN: 9780190931919
Author: NEWNAN
Publisher: Oxford University Press
expand_more
expand_more
format_list_bulleted
Concept explainers
Question

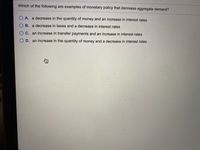
Transcribed Image Text:Which of the following are examples of monetary policy that decrease aggregate demand?
O A. a decrease in the quantity of money and an increase in interest rates
O B. a decrease in taxes and a decrease in interest rates
O C. an increase in transfer payments and an increase in interest rates
O D. an increase in the quantity of money and a decrease in interest rates
身
Expert Solution
This question has been solved!
Explore an expertly crafted, step-by-step solution for a thorough understanding of key concepts.
This is a popular solution
Trending nowThis is a popular solution!
Step by stepSolved in 4 steps

Knowledge Booster
Learn more about
Need a deep-dive on the concept behind this application? Look no further. Learn more about this topic, economics and related others by exploring similar questions and additional content below.Similar questions
- no chatgtp answerarrow_forwardII. Illustrate cach of the following situations with a graph showing IS curve: An increase in government spending a. b. An increase in taxes III. Illustrate each of the following situations with a graph showing Fed rule curve: a. An increase in Z factors b. A decrease in the price level IV. Illustrate each of the following situations with a graph showing AS and AD curve and show the changes in cquilibrium values of the price level and aggregate output: a. An increase in the capital stock and decrease in taxes b. A decrease in energy prices and increase in Government spendingarrow_forwardThe slope of the ADTT curve is determined by: O a. The monetary policy of targets and instruments of the central bank O b. All of the above O c. The expenditure multiplier O d. The changes in and aggregate expenditure when interest rates changearrow_forward
- he interest-rate effect suggests that: A. an increase in the price level will increase interest rates, and decrease investment and aggregate demand. B. an increase in the price level will reduce interest rates, and decrease investment and aggregate demand. C. a decrease in the supply of money will increase interest rates and reduce interest-sensitive consumption and investment spending. D. an increase in the price level will reduce interest rates, and increase investment and aggregate demand.arrow_forwardtrue falsearrow_forwardRaising the federal funds rate the aggregate demand curve so that equilibrium real GDP and the price level decreases; increases; rises O b. increases; increases; falls decreases; decreases; rises O d. increases; increases; rises O e decreases; decreases; fallsarrow_forward
- What sort of event could lead to a simultaneous decrease in the rates of inflation and unemployment? an increase in money supply a decrease in raw material prices a decrease in money supply O an adverse supply shockarrow_forwardQuestion 8 1 pts Let's say the Aggregate Demand is less than potential output. Our goal is to keep the short run curves in equilibrium with the long run curves. To fix this, you would O increase the required reserves and increase taxes O increase interest rates and increase taxes O decrease government spending and increase taxes O increase the money supply and increase government spendingarrow_forwardWhen the Federal Reserve buys government securities from a bank, the money supply ________ and interest rates ________. increases; rise decreases; rise decreases; fall increases; fallarrow_forward
- The Federal Reserve expands the money supply by 5 percent.a. Use the theory of liquidity preference to illustrate in a graph theimpact of this policy on the interest rate.b. Use the model of aggregate demand and aggregate supply to illustratethe impact of this change in the interest rate on output and the pricelevel in the short run.c. When the economy makes the transition from its short-runequilibrium to its new long-run equilibrium, what will happen to theprice level?d. How will this change in the price level affect the demand for moneyand the equilibrium interest rate?e. Is this analysis consistent with the proposition that money has realeffects in the short run but is neutral in the long run?arrow_forwardPls help with below homework.arrow_forwardUsing the graphs below, show the change in aggregate demand for each of the following scenarios. a. There is a change in government policy that causes an increase in interest rates Instructions: Use the tool provided "AD1" to plot the new aggregate demand curve. Plot only the endpoints of the line (2 0 Aggregate Demand Price Level Real GDP Tools Oarrow_forward
arrow_back_ios
SEE MORE QUESTIONS
arrow_forward_ios
Recommended textbooks for you

 Principles of Economics (12th Edition)EconomicsISBN:9780134078779Author:Karl E. Case, Ray C. Fair, Sharon E. OsterPublisher:PEARSON
 Engineering Economy (17th Edition)EconomicsISBN:9780134870069Author:William G. Sullivan, Elin M. Wicks, C. Patrick KoellingPublisher:PEARSON
 Principles of Economics (MindTap Course List)EconomicsISBN:9781305585126Author:N. Gregory MankiwPublisher:Cengage Learning
 Managerial Economics: A Problem Solving ApproachEconomicsISBN:9781337106665Author:Luke M. Froeb, Brian T. McCann, Michael R. Ward, Mike ShorPublisher:Cengage Learning
 Managerial Economics & Business Strategy (Mcgraw-...EconomicsISBN:9781259290619Author:Michael Baye, Jeff PrincePublisher:McGraw-Hill Education


Principles of Economics (12th Edition)
Economics
ISBN:9780134078779
Author:Karl E. Case, Ray C. Fair, Sharon E. Oster
Publisher:PEARSON

Engineering Economy (17th Edition)
Economics
ISBN:9780134870069
Author:William G. Sullivan, Elin M. Wicks, C. Patrick Koelling
Publisher:PEARSON

Principles of Economics (MindTap Course List)
Economics
ISBN:9781305585126
Author:N. Gregory Mankiw
Publisher:Cengage Learning

Managerial Economics: A Problem Solving Approach
Economics
ISBN:9781337106665
Author:Luke M. Froeb, Brian T. McCann, Michael R. Ward, Mike Shor
Publisher:Cengage Learning

Managerial Economics & Business Strategy (Mcgraw-...
Economics
ISBN:9781259290619
Author:Michael Baye, Jeff Prince
Publisher:McGraw-Hill Education