MATLAB: An Introduction with Applications
6th Edition
ISBN: 9781119256830
Author: Amos Gilat
Publisher: John Wiley & Sons Inc
expand_more
expand_more
format_list_bulleted
Concept explainers
Topic Video
Question
When computing the standard deviation, does it matter whether the data are sample data or data comprising the entire population? Choose one answer:
A. Yes. The formula for s is divided by n, while the formula for ? is divided by N − 1.
B. Yes. The formula for s is divided by n − 1, while the formula for ? is divided by N.
C. No. The formula for both s and ? is divided by n − 1.
D. No. The formula for both s and ? is divided by N.
Expert Solution
arrow_forward
Step 1
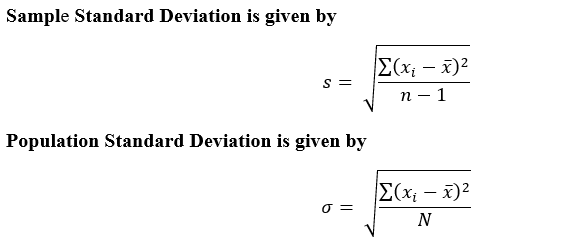
We know that for sample data we use (n-1) while calculating sample standard deviation whereas for the population we use N.
Formulas are given below-

Trending nowThis is a popular solution!
Step by stepSolved in 2 steps with 1 images

Knowledge Booster
Learn more about
Need a deep-dive on the concept behind this application? Look no further. Learn more about this topic, statistics and related others by exploring similar questions and additional content below.Similar questions
- During an experiment, the following times (in seconds) were recorded. Find the mean. 6.3, 5.4, 6, 3.2, 5.4, 5.5 ... The mean is (Round to one decimal place as needed.) ...arrow_forwardWhen calculating the test statistic for a one sample t test, the denominator term in the formula is __________ a. the estimated SEM b. the estimated standard error of mean differences c. the mean difference d. the deviation scorearrow_forwardEnglish Philippines) e to search Given Samples A and B below, Sample A: Sample B: Sample A: - 3.2 4.6 Sample B: - a. Calculate the mean and standard deviation for each sample. 2.1 2.6 Sample B: CV- 0.00 0.00 4.5 4.5 2.0 3.2 3.6 2.8 SA 0.00 96 50 11 b. Calculate the coefficient of variation for each sample. Sample A: CV. - 0.00 % E Round to two decimal places if necessari c. Which sample is more variable? 0.00 0.00 2.6 3.1 Sample A Sample B Neither sample is more variable than the other 3.8 4.1 3.8 4.9 3.5 4.6 land Iarrow_forward
- Answer.arrow_forwardIn a city with three high schools, all the ninth graders took a Standardized Test, with these results: High School Mean score on test Number of ninth graders Glenwood 80 289 Central City 93 342 Lincoln High The city's PR manager, who never took statistics, claimed the mean score of all ninth graders in the city was 80. Of course, that is incorrect. What is the mean score for all ninth graders in the city? Round to one decimal place. 67 170 mean of all ninth grader's scores =arrow_forwardThree students were applying to the same graduate school. They came from schools with different grading systems. Vichet is Kamala is Number Number Student GPA School Average GPA School Standard Deviation Thuy 2.4 2.2 0.5 Vichet 85 96 How many standard deviations is each student away from hiir school average? If the student GPA is higher than his school average, enter this as a positive number. If the student GPA is lower than his school average, enter this as a negative number. Thuy is Number Kamala 8.7 8.2 Table 2.74 20 0.8 standard deviations from Thuy's school average. standard deviations from Vichet's school average. standard deviations from Kamala's school average.arrow_forward
- Steve's average golf score at his local course is 92.9 from a random sample of 60 rounds of golf. Assume that the population standard deviation for his golf score is 4.2. The standard error of the mean for this sample is ________. A) 0.54 B) 1.17 C) 1.56 D) 2.30arrow_forwardThe test scores on a science quiz were: 50 50 63 71 74 74 75 77 78 80 85 99. This is a population! ALL QUIZ GRADES! Determine the mean (round to the nearest whole number) and standard deviation (Round to the hundredth place- two decimals). The mean is? and the deviation is ?arrow_forward
arrow_back_ios
arrow_forward_ios
Recommended textbooks for you
 MATLAB: An Introduction with ApplicationsStatisticsISBN:9781119256830Author:Amos GilatPublisher:John Wiley & Sons Inc
 Probability and Statistics for Engineering and th...StatisticsISBN:9781305251809Author:Jay L. DevorePublisher:Cengage Learning
 Statistics for The Behavioral Sciences (MindTap C...StatisticsISBN:9781305504912Author:Frederick J Gravetter, Larry B. WallnauPublisher:Cengage Learning
 Elementary Statistics: Picturing the World (7th E...StatisticsISBN:9780134683416Author:Ron Larson, Betsy FarberPublisher:PEARSON
 The Basic Practice of StatisticsStatisticsISBN:9781319042578Author:David S. Moore, William I. Notz, Michael A. FlignerPublisher:W. H. Freeman
 Introduction to the Practice of StatisticsStatisticsISBN:9781319013387Author:David S. Moore, George P. McCabe, Bruce A. CraigPublisher:W. H. Freeman

MATLAB: An Introduction with Applications
Statistics
ISBN:9781119256830
Author:Amos Gilat
Publisher:John Wiley & Sons Inc

Probability and Statistics for Engineering and th...
Statistics
ISBN:9781305251809
Author:Jay L. Devore
Publisher:Cengage Learning

Statistics for The Behavioral Sciences (MindTap C...
Statistics
ISBN:9781305504912
Author:Frederick J Gravetter, Larry B. Wallnau
Publisher:Cengage Learning

Elementary Statistics: Picturing the World (7th E...
Statistics
ISBN:9780134683416
Author:Ron Larson, Betsy Farber
Publisher:PEARSON

The Basic Practice of Statistics
Statistics
ISBN:9781319042578
Author:David S. Moore, William I. Notz, Michael A. Fligner
Publisher:W. H. Freeman

Introduction to the Practice of Statistics
Statistics
ISBN:9781319013387
Author:David S. Moore, George P. McCabe, Bruce A. Craig
Publisher:W. H. Freeman