MATLAB: An Introduction with Applications
6th Edition
ISBN: 9781119256830
Author: Amos Gilat
Publisher: John Wiley & Sons Inc
expand_more
expand_more
format_list_bulleted
Question

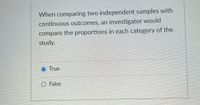
Transcribed Image Text:When comparing two independent samples with
continuous outcomes, an investigator would
compare the proportions in each category of the
study.
True
O False
Expert Solution
This question has been solved!
Explore an expertly crafted, step-by-step solution for a thorough understanding of key concepts.
This is a popular solution
Trending nowThis is a popular solution!
Step by stepSolved in 2 steps

Knowledge Booster
Similar questions
- Why do we use subscripts when working with two samples?arrow_forwardonly parts D, E, & Farrow_forwardWe often describe our emotional reaction to social rejection as “pain.” A clever study asked whether social rejection causes activity in areas of the brain that are known to be activated by physical pain. If it does, we really do experience social and physical pain in similar ways. Subjects were first included and then deliberately excluded from a social activity while changes in brain activity were measured. After each activity, the subjects filled out questionnaires that assessed how excluded they felt. Here are data for 13 subjects. The explanatory variable is “social distress” measured by each subject’s questionnaire score after exclusion relative to the score after inclusion. (So values greater than 1 show the degree of distress caused by exclusion.) The response variable is change in activity in a region of the brain that is activated by physical pain. create a scatterplotarrow_forward
- Calculate the relevant test statistic. Round your answer to two decimal places. t-statistic = i Find the p-value. Round your answer to three decimal places. p-value = iarrow_forwardIn tests of proportions, the data is qualitative. True Falsearrow_forwardWhich statistical method would be most effective to determine if the average size of dogs in Europe was different than the average size of dogs in the U.S.? Why?arrow_forward
- In a study examining the relation of math ability to the belief that math ability was innate, the belief was considered the predictor variable. The researcher hopes to find a correlation between the participants’ math ability and their belief that math ability is innate. The scores for the three participants are shown below. The group that believed that math is NOT innate scored 66, 70, 50. The group that believed that math IS innate scored 7, 4,10. what are the mean and SD for each group?arrow_forwardIn a test of significance, you can conclude there is a statistically significant relationship when:arrow_forwardSmallpox Vaccine.ABCNEWS.com published the results of a poll that asked U.S. adults whether they would get a smallpox shot if it were available. Sampling, data collection, and tabulation were done by TNS Intersearch of Horsham, Pennsylvania. When the risk of the vaccine was described in detail, 4 in 10 of those surveyed said they would take the smallpox shot. According to the article, “the results have a three-point margin of error” (for a 0.95 confidence level). Use the information provided to obtain a 95% confidence interval for the percentage of all U.S. adults who would take a smallpox shot, knowing the risk of the vaccine.arrow_forward
- If your goal is to not only explore a relationship between two variables but also predict one given the value of the other, which type of statistical test is most appropriate?arrow_forwardIdentify the statistical test that should be used to analyze the data for the following study: Does a GRE prep course improve GRE scores? GRE practice test scores were compared before and after 40 students had taken a very expensive GRE prep course.arrow_forwardwhat was the margin of error for this study?arrow_forward
arrow_back_ios
SEE MORE QUESTIONS
arrow_forward_ios
Recommended textbooks for you
 MATLAB: An Introduction with ApplicationsStatisticsISBN:9781119256830Author:Amos GilatPublisher:John Wiley & Sons Inc
 Probability and Statistics for Engineering and th...StatisticsISBN:9781305251809Author:Jay L. DevorePublisher:Cengage Learning
 Statistics for The Behavioral Sciences (MindTap C...StatisticsISBN:9781305504912Author:Frederick J Gravetter, Larry B. WallnauPublisher:Cengage Learning
 Elementary Statistics: Picturing the World (7th E...StatisticsISBN:9780134683416Author:Ron Larson, Betsy FarberPublisher:PEARSON
 The Basic Practice of StatisticsStatisticsISBN:9781319042578Author:David S. Moore, William I. Notz, Michael A. FlignerPublisher:W. H. Freeman
 Introduction to the Practice of StatisticsStatisticsISBN:9781319013387Author:David S. Moore, George P. McCabe, Bruce A. CraigPublisher:W. H. Freeman

MATLAB: An Introduction with Applications
Statistics
ISBN:9781119256830
Author:Amos Gilat
Publisher:John Wiley & Sons Inc

Probability and Statistics for Engineering and th...
Statistics
ISBN:9781305251809
Author:Jay L. Devore
Publisher:Cengage Learning

Statistics for The Behavioral Sciences (MindTap C...
Statistics
ISBN:9781305504912
Author:Frederick J Gravetter, Larry B. Wallnau
Publisher:Cengage Learning

Elementary Statistics: Picturing the World (7th E...
Statistics
ISBN:9780134683416
Author:Ron Larson, Betsy Farber
Publisher:PEARSON

The Basic Practice of Statistics
Statistics
ISBN:9781319042578
Author:David S. Moore, William I. Notz, Michael A. Fligner
Publisher:W. H. Freeman

Introduction to the Practice of Statistics
Statistics
ISBN:9781319013387
Author:David S. Moore, George P. McCabe, Bruce A. Craig
Publisher:W. H. Freeman