
MATLAB: An Introduction with Applications
6th Edition
ISBN: 9781119256830
Author: Amos Gilat
Publisher: John Wiley & Sons Inc
expand_more
expand_more
format_list_bulleted
Related questions
Question
thumb_up100%
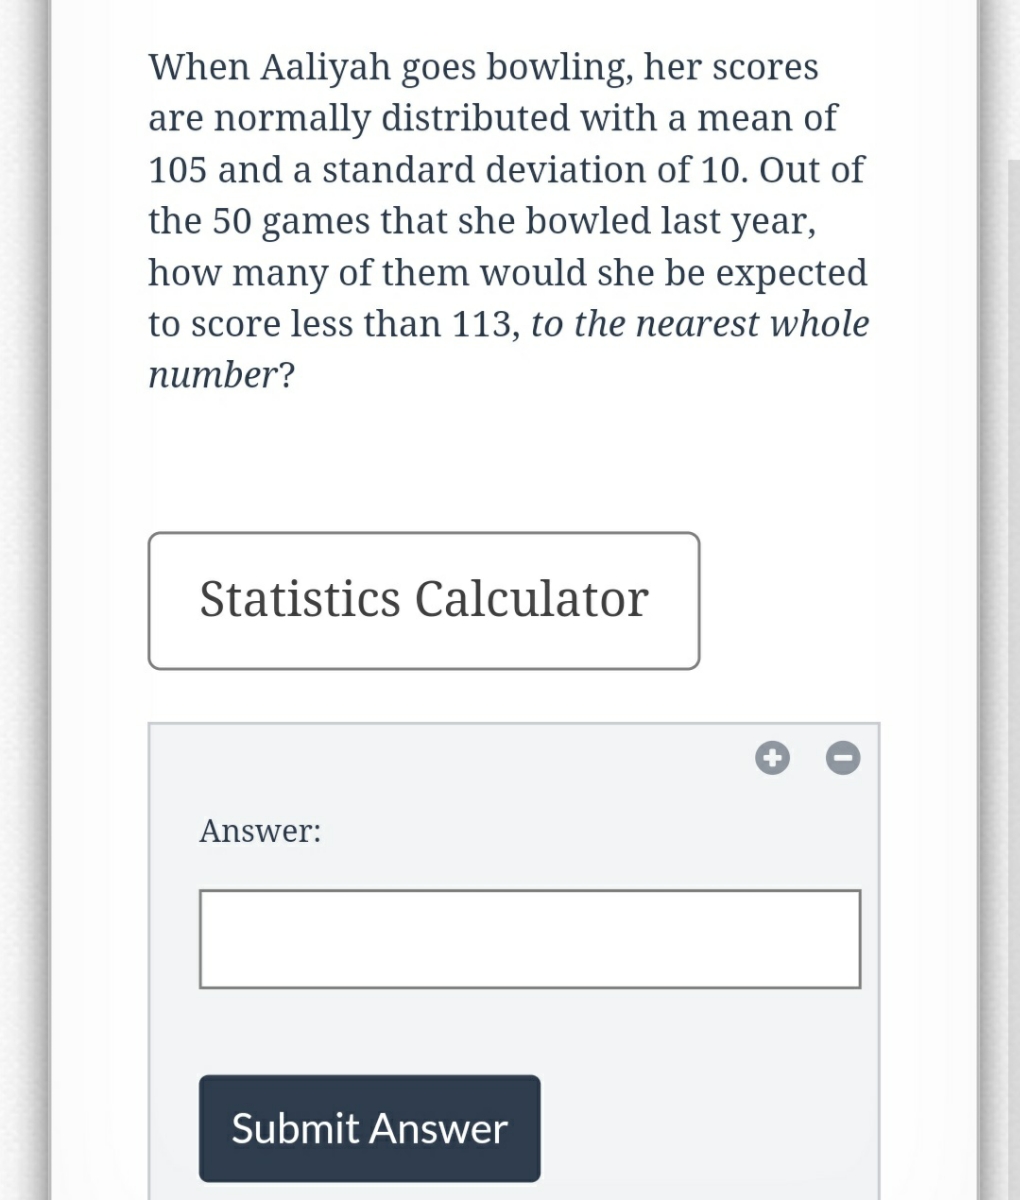

Transcribed Image Text:When Aaliyah goes bowling, her scores
are normally distributed with a mean of
105 and a standard deviation of 10. Out of
the 50 games that she bowled last year,
how many of them would she be expected
to score less than 113, to the nearest whole
number?
Statistics Calculator
Answer:
Submit Answer
Expert Solution
This question has been solved!
Explore an expertly crafted, step-by-step solution for a thorough understanding of key concepts.

This is a popular solution

Trending nowThis is a popular solution!

Step by stepSolved in 3 steps with 1 images

Knowledge Booster

Similar questions
- Moddel Parameters (Points) Source Value Standard Error t Pr > |t| Intercept 0.437798 5.9182 0.073948 0.9428 Hours 0.829539 0.109474 7.57748 0.0001 Analysis of Variance (Points) Source Sum of Squares Df Mean Square F Pr > |t| Model 3249.72 1 3249.72 57.42 0.0001 Error 452.779 8 56.5974 Corrected Total 3702.5 9 1. Use the estimatedd regression to predict the points of a student who spent 50 hours studying for this course. A. Y=50, so Y^=50 B. X=50, so Y^=0.83+0.44(50)=22.83 C. X=50, so Y^=0.44+0.83(50)=41.94 D. Unable to find. 1a. If a student spennt 120 hours studying for this course, would you feeel comfortable to use your estimated regresssion equation to predict his points? Why? A. The range of X in our data is from 10 to 85. X = 120 is outside the range of X. I do not feel comfortable to use my estimated regression equation to predict his points as the linear relationship may not hold when X = 120. B. I know that 120 hours is…arrow_forwardRandom Variables OPEN 21 -2.5) = P(Z 0.8) = Submit answer US acerarrow_forwardNormal Distributions Break Out X с MTH 245-Z03: Statistics I (SP23) = Quiz: Test 2 REVIEW - Chapters 3-5 Question list Question 36 O Question 37 O Question 38 O Question 39 O Question 40 Question 41 O Question 42 Question 43 Question 44 Question 45 Textbook Section 4.2 Homework mylab.pearson.com/Student/PlayerTest.aspx?canvas_enrollment_state=active&canvas_user_id=1000424&canvas_module_item_id=38031780&canvas_assignment_... K X P Test 2 REVIEW - Chapters 3-5 X (a) What is the maximum score that can be in the bottom 5% of scores? (b) Between what two values does the middle 90% of scores lie? (a) The maximum score that can be in the bottom 5% is (Round to two decimal places as needed.) (40) Do Better - YouTube < Question 42 of 50 (b) The middle 90% of scores lies between (Round to two decimal places as needed.) The test scores for the analytical writing section of a particular standardized test can be approximated by a normal distribution, as shown in the figure. on the low end and x +…arrow_forward
- chwelvearrow_forwardStandard normal distribution, to find the area of the shaded region, the graph shows the standard normal distribution of bone density scores with mean 0 and standard deviation 1 z= 1.07 and z=0.67arrow_forwardStandard Normal Distribution Using the standard normal distribution, find:P(z > 1.87) Enter answer to 4 decimal places.arrow_forward
- COURSE LEARNING OUTCOME Perform a hypothesis test for two population proportions. Give the null hypothesis, alternative hypothesis, reject or fail to reject the null hypothesis, and give the conclusion. a) For the Claim P1< P2 state the null hypothesis and alternative hypothesis in symbols b) For the P-value = 0.073, state whether you reject or fail to reject the null hypothesis if the significance level is 0.05 and why. c) State the conclusion of the problem.arrow_forwardWhen does the chi-square distribution approximate the normal distribution? df > 30 df > 90 df > 1000 It never approximates the normal distribution.arrow_forward
arrow_back_ios
arrow_forward_ios
Recommended textbooks for you
- MATLAB: An Introduction with ApplicationsStatisticsISBN:9781119256830Author:Amos GilatPublisher:John Wiley & Sons Inc
 Probability and Statistics for Engineering and th...StatisticsISBN:9781305251809Author:Jay L. DevorePublisher:Cengage Learning
 Statistics for The Behavioral Sciences (MindTap C...StatisticsISBN:9781305504912Author:Frederick J Gravetter, Larry B. WallnauPublisher:Cengage Learning
  Elementary Statistics: Picturing the World (7th E...StatisticsISBN:9780134683416Author:Ron Larson, Betsy FarberPublisher:PEARSON
 The Basic Practice of StatisticsStatisticsISBN:9781319042578Author:David S. Moore, William I. Notz, Michael A. FlignerPublisher:W. H. Freeman
 Introduction to the Practice of StatisticsStatisticsISBN:9781319013387Author:David S. Moore, George P. McCabe, Bruce A. CraigPublisher:W. H. Freeman
MATLAB: An Introduction with Applications
Statistics
ISBN:9781119256830
Author:Amos Gilat
Publisher:John Wiley & Sons Inc
Probability and Statistics for Engineering and th...
Statistics
ISBN:9781305251809
Author:Jay L. Devore
Publisher:Cengage Learning
Statistics for The Behavioral Sciences (MindTap C...
Statistics
ISBN:9781305504912
Author:Frederick J Gravetter, Larry B. Wallnau
Publisher:Cengage Learning
Elementary Statistics: Picturing the World (7th E...
Statistics
ISBN:9780134683416
Author:Ron Larson, Betsy Farber
Publisher:PEARSON
The Basic Practice of Statistics
Statistics
ISBN:9781319042578
Author:David S. Moore, William I. Notz, Michael A. Fligner
Publisher:W. H. Freeman
Introduction to the Practice of Statistics
Statistics
ISBN:9781319013387
Author:David S. Moore, George P. McCabe, Bruce A. Craig
Publisher:W. H. Freeman